Understanding Run-Up Analysis
Definition: What is Run-Up Analysis?
Run-up analysis is the systematic measurement and evaluation of vibration amplitude and phase during equipment acceleration from rest or low speed to operating speed. Continuous data recording during startup enables identification of critical speeds (visible as peaks in amplitude), assessment of damping (from peak sharpness), detection of startup-specific problems (thermal bow), and validation of startup procedures. Data is typically displayed as Bode plots (amplitude and phase vs. speed) and waterfall plots showing spectral evolution.
Run-up analysis is essential for new equipment commissioning (verifying design predictions), troubleshooting startup vibration issues, and periodic health assessment by comparing current to historical run-up signatures to detect degradation.
Data Collection
Required Measurements
- Vibration: Continuous recording at all bearing locations
- Speed: Tachometer signal for RPM tracking
- Phase: Once-per-revolution pulse for phase measurement
- Duration: From start button to stable operating speed
- Sampling: Continuous or time-based snapshots
Instrumentation Setup
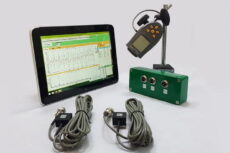
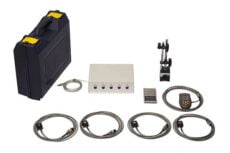
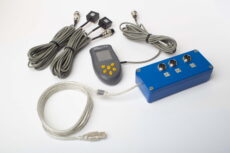
- Multi-channel analyzer or data acquisition system
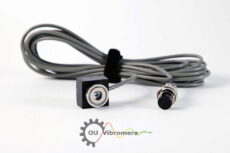
- Accelerometers on all bearings (horizontal, vertical, axial)
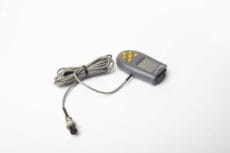
- Optical or laser tachometer with reflective tape
- Triggered recording starting before acceleration begins
Analysis Outputs
Bode Plot
Standard run-up display:
- Upper Plot: Vibration amplitude vs. speed
- Lower Plot: Phase angle vs. speed
- Critical Speeds: Amplitude peaks with 180° phase shift
- Multiple Plots: One per measurement location/direction
Waterfall (Cascade) Plot
- 3D visualization: frequency, speed, amplitude
- Shows complete spectral evolution
- 1× component tracks diagonally with speed
- Natural frequencies appear as vertical features
- Intersections indicate critical speeds
Polar Plot
- Vector plot of amplitude and phase
- Characteristic spiral through critical speeds
- Used in advanced rotor dynamics analysis
Information Obtained
Critical Speed Identification
- Peaks in amplitude plot mark critical speeds
- 180° phase shift confirms resonance
- All critical speeds between zero and operating speed identified
- Compare to design predictions
Damping Assessment
- Sharp Peaks: Low damping (Q = 20-50), potential problem
- Broad Peaks: High damping (Q = 5-10), safer passage
- Quantitative: Calculate damping ratio from peak width
Separation Margins
- Verify operating speed separated from critical speeds
- Typical requirement: ±20-30% margin
- Adequate separation = safe operation
- Insufficient separation = potential resonance operation
Startup Procedure Validation
- Verify acceleration rate adequate to pass through critical speeds
- Confirm vibration remains within limits at all speeds
- Identify if hold points needed
Comparison with Coastdown
Similarities
- Both identify critical speeds and natural frequencies
- Same analysis techniques and plots
- Complementary data
Differences
- Run-Up: Increasing speed, cold to warm transition, powered acceleration
- Coastdown: Decreasing speed, warm to cool, natural deceleration
- Comparison: Differences reveal thermal or load-dependent effects
Applications
Commissioning
- New equipment first starts
- Verify meets design specifications
- Baseline for future comparison
- Acceptance testing requirement
Periodic Assessment
- Annual or semi-annual run-up tests
- Compare to baseline
- Detect changes (critical speed shifts, damping changes)
- Trend data for degradation detection
Troubleshooting
- Startup vibration problems
- Determine if resonance-related
- Assess modifications effectiveness
Run-up analysis provides comprehensive rotor dynamic characterization through startup vibration measurement. The resulting Bode and waterfall plots reveal critical speeds, damping characteristics, and startup behavior essential for equipment commissioning, periodic health assessment, and troubleshooting startup-related vibration problems in rotating machinery.
