Understanding Operating Deflection Shape (ODS) Analysis
Definition: What is an Operating Deflection Shape?
Operating Deflection Shape (ODS) analysis is a technique used to visualize the actual vibration pattern of a machine and its support structure under its normal operating conditions. It involves measuring the vibration (amplitude and phase) at many points on the machine’s surface and then using this data to create a dynamic, animated 3D model that shows exactly how the structure is moving, bending, and twisting at a specific frequency.
Essentially, an ODS is a snapshot of a structure’s vibration, showing the combined response to all the operational forces acting upon it, such as unbalance, misalignment, and aerodynamic or hydraulic forces.
ODS vs. Modal Analysis
ODS is often confused with Modal Analysis, but they are fundamentally different:
- ODS Analysis:
- Measures the forced response of a structure to the forces present during *operation*.
- Shows you *what is* happening under real-world conditions.
- The machine is running normally during the test.
- Modal Analysis:
- Measures the inherent dynamic properties of a structure (its natural frequencies, damping, and mode shapes).
- Shows you *what could* happen if the structure were excited at one of its natural frequencies.
- The machine is turned off, and the structure is artificially excited with a calibrated impact hammer or a shaker.
In simple terms, ODS shows the problem as it’s happening, while Modal Analysis helps to understand the underlying structural properties that might be contributing to the problem (e.g., a resonance condition).
The ODS Analysis Process
- Create a 3D Model: A geometric model of the machine and its structure is created in the ODS software. This model consists of a grid of points where measurements will be taken.
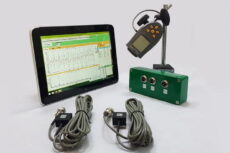
- Acquire Data: A multi-channel vibration analyzer is used. One accelerometer is kept at a fixed “reference” location, while another “roving” accelerometer is moved to each of the other points on the model. At each point, the analyzer measures the vibration amplitude and, crucially, the phase relationship between the roving sensor and the reference sensor.
- Process and Animate: The software uses the collected amplitude and phase data to calculate the relative motion of each point on the model. It can then generate an animated video that exaggerates the machine’s movement, making the deflection shapes clearly visible to the human eye.
The animation can be generated for any frequency of interest, but it is most often used to visualize the machine’s movement at its primary running speed (1X) or other problem frequencies identified in the FFT spectrum.
Why is ODS Analysis Useful?
ODS is a powerful problem-solving tool because it makes vibration visible. It helps to:
- Identify the Root Cause of Vibration: By watching the animated model, engineers can distinguish between issues like a bent shaft, misalignment, a “soft foot” condition, or a flexible base. For example, a soft foot problem will show one of the machine’s feet moving out of phase with the others and the foundation.
- Confirm Resonance: If the operating deflection shape at a problem frequency closely matches a natural frequency’s mode shape (found via modal analysis), it provides definitive proof of a resonance problem.
- Locate Structural Weakness: The animation can highlight areas of excessive flexibility or weak points in a machine’s base, frame, or associated piping.
- Communicate Problems Effectively: An animated video of a machine shaking itself apart is a much more powerful communication tool for managers and non-technical personnel than a complex vibration spectrum.
