Understanding Coastdown in Rotating Machinery Analysis
Definition: What is Coastdown?
Coastdown (also called rundown or deceleration) is the process of allowing a rotating machine to slow down from operating speed to a stop without applying active braking, relying on natural deceleration from friction, windage, and other losses. In the context of rotor dynamics and vibration analysis, a coastdown test is a diagnostic procedure where vibration data is continuously recorded as the machine decelerates, providing valuable information about critical speeds, natural frequencies, and system dynamic characteristics.
Coastdown testing is a fundamental tool for commissioning new equipment, troubleshooting vibration problems, and validating rotor dynamic models.
Purpose and Applications
1. Critical Speed Identification
The primary purpose of coastdown testing is identifying critical speeds:
- As speed decreases through each critical speed, vibration amplitude peaks
- Peaks in amplitude vs. speed plot mark critical speeds
- Accompanying 180° phase shift confirms resonance
- Multiple critical speeds can be identified in a single test
2. Natural Frequency Measurement
Critical speeds correspond to natural frequencies:
- First critical speed occurs at first natural frequency
- Second critical at second natural frequency, etc.
- Provides experimental verification of analytical predictions
- Used to validate finite element models
3. Damping Determination
The sharpness of resonance peaks reveals system damping:
- Sharp, high peaks indicate low damping
- Broad, low peaks indicate high damping
- Damping ratio can be calculated from peak width and amplitude
- Critical for predicting vibration levels during future operation
4. Unbalance Distribution Assessment
- Phase relationships at critical speeds reveal unbalance distribution
- Can identify static vs. couple unbalance
- Helps plan balancing strategy
Coastdown Test Procedure
Preparation
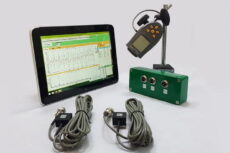
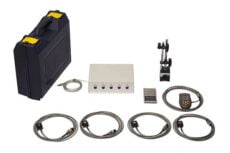
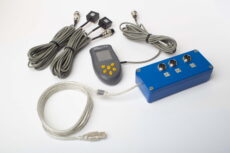
- Install Sensors: Place accelerometers or velocity transducers at bearing locations in horizontal and vertical directions
- Install Tachometer: Optical or magnetic sensor to track rotational speed and provide phase reference
- Configure Data Acquisition: Set up continuous recording with adequate sample rate
- Define Speed Range: Typical range from operating speed down to 10-20% of operating speed or until machine stops
Execution
- Stabilize at Operating Speed: Run at normal speed until thermal equilibrium and steady vibration
- Initiate Coastdown: Disconnect drive power (motor, turbine, etc.) and allow natural deceleration
- Continuous Monitoring: Record vibration amplitude, phase, and speed throughout deceleration
- Safety Monitoring: Watch for excessive vibration indicating unexpected resonances or instabilities
- Complete Deceleration: Continue recording until machine stops or reaches minimum speed of interest
Data Collection Parameters
- Sample Rate: High enough to capture all frequencies of interest (typically 10-20× maximum frequency)
- Duration: Depends on rotor inertia—may be 30 seconds to 10 minutes
- Measurements: Vibration amplitude, phase, speed at all sensor locations
- Synchronous Sampling: Data sampled at constant angular increments for order analysis
Data Analysis and Visualization
Bode Plot
The standard visualization for coastdown data is the Bode plot:
- Upper Plot: Vibration amplitude vs. speed
- Lower Plot: Phase angle vs. speed
- Critical Speed Signature: Amplitude peak with corresponding 180° phase shift
- Multiple Plots: Separate plots for each measurement location and direction
Waterfall Plot
Waterfall plots provide 3D visualization:
- X-axis: Frequency (Hz or orders)
- Y-axis: Speed (RPM)
- Z-axis (color): Vibration amplitude
- 1× Component: Appears as diagonal line tracking with speed
- Natural Frequencies: Appear as horizontal lines (constant frequency)
- Intersection Points: Where 1× line crosses natural frequency line = critical speed
Polar Plot
- Vibration vectors plotted at multiple speeds
- Characteristic spiral pattern as speed decreases through critical speeds
- Phase changes clearly visible
Coastdown vs. Runup Testing
Coastdown Advantages
- No External Power Required: Simply disconnect drive and let machine coast
- Slower Deceleration: More time at each speed, better resolution
- Safer: System naturally losing energy rather than gaining it
- Less Stress: Critical speeds passed with decreasing energy
Runup Advantages
- Controlled Acceleration: Can control rate through critical speeds
- Part of Normal Startup: Data collected during routine startup
- Active Conditions: Process loads present, more representative of operation
Comparison Considerations
- Temperature Effects: Runup performed cold; coastdown from hot operating conditions
- Bearing Stiffness: May differ between hot (coastdown) and cold (runup)
- Friction and Damping: Temperature-dependent, affecting peak amplitudes
- Data Comparison: Differences between runup and coastdown data can reveal thermal or load effects
Applications and Use Cases
New Equipment Commissioning
- Verify critical speeds match design predictions
- Confirm adequate separation margins
- Validate rotor dynamic models
- Establish baseline data for future reference
Troubleshooting Vibration Problems
- Determine if high vibration is speed-related (resonance)
- Identify previously unknown critical speeds
- Assess effects of modifications or repairs
- Distinguish resonance from other vibration sources
Balancing Procedures
- For flexible rotors, coastdown identifies which modes need balancing
- Determines appropriate balancing speeds
- Verifies improvement after modal balancing
Modification Verification
- After bearing changes, verify critical speed shifts
- After mass or stiffness changes, confirm predicted natural frequency changes
- Compare before/after coastdown data to quantify improvement
Best Practices for Coastdown Testing
Safety Considerations
- Ensure all personnel aware test is in progress
- Monitor vibration closely for unexpected resonances
- Have emergency shutdown capability available
- Clear area around equipment during test
- If excessive vibration develops, consider emergency stop rather than completing coastdown
Data Quality
- Adequate Deceleration Rate: Not too fast (insufficient data points at each speed) or too slow (thermal changes during test)
- Stable Conditions: Minimize process variable changes during test
- Multiple Runs: Perform 2-3 coastdowns for repeatability verification
- All Measurement Locations: Record data at all bearings simultaneously
Documentation
- Record operating conditions (temperature, load, configuration)
- Capture complete vibration and speed data
- Generate standard analysis plots (Bode, waterfall, polar)
- Identify and mark all critical speeds found
- Compare to design predictions or previous test data
- Archive data for future reference
Interpretation of Results
Identifying Critical Speeds
- Look for amplitude peaks in Bode plot
- Confirm with 180° phase shift
- Note speed at which peak occurs
- Calculate separation margin from operating speed
Assessing Severity
- Peak Amplitude: How high does vibration reach at critical speed?
- Peak Sharpness: Sharp peak indicates low damping, potential problem
- Operating Proximity: How close is operating speed to critical speeds?
- Acceptability: Typically require ±15-20% separation margin
Advanced Analysis
- Extract mode shapes from multi-point measurements
- Calculate damping ratios from peak characteristics
- Identify forward vs. backward whirl modes
- Compare to Campbell diagram predictions
Coastdown testing is an essential diagnostic tool in rotor dynamics, providing empirical data that complements analytical predictions and revealing the actual dynamic behavior of rotating machinery under real operating conditions.
