Understanding Coastdown Analysis
Definition: What is Coastdown Analysis?
Coastdown analysis is systematic vibration measurement and evaluation during equipment deceleration from operating speed to stop after power is disconnected, recording amplitude, phase, and spectral content throughout the speed range. Analysis of coastdown data through Bode plots and waterfall displays reveals critical speeds, natural frequencies, damping characteristics, and rotor dynamic behavior essential for equipment commissioning, troubleshooting, and periodic condition verification.
Coastdown analysis is closely related to run-up analysis but offers advantages of natural unpowered deceleration (simpler, safer) and hot operating-temperature conditions (vs. cold startup). It’s a standard test for turbomachinery acceptance and a valuable periodic diagnostic performed during planned shutdowns.
Test Procedure
Preparation
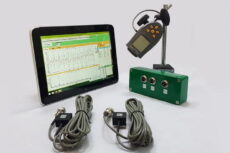
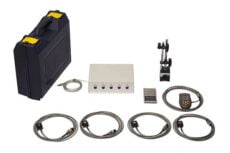
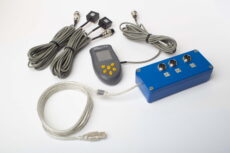
- Install accelerometers at all bearing locations
- Connect tachometer for speed and phase reference
- Configure data acquisition for continuous recording
- Establish trigger conditions (speed range, duration)
Execution
- Stabilize: Equipment at steady operating speed
- Initiate Recording: Start data acquisition
- Disconnect Power: Motor power off, turbine fuel cutoff, etc.
- Monitor: Watch vibration during deceleration
- Record Complete: Continue to stop or minimum speed of interest
- Save Data: Archive complete coastdown dataset
Duration
- Depends on rotor inertia and friction
- Small motors: 30-60 seconds
- Large turbines: 10-30 minutes
- Longer coastdowns provide more data points (better resolution)
Data Analysis
Bode Plot Generation
- Extract vibration amplitude at each speed (from tracking filter)
- Extract phase angle at each speed
- Plot both vs. speed
- Critical speeds appear as amplitude peaks with phase transitions
Waterfall Plot
- Compute FFT at regular speed intervals
- Stack spectra to create 3D display
- Speed-synchronous components (1×, 2×) track diagonally
- Fixed-frequency components (natural frequencies) appear vertical
- Critical speeds visible as intersections
Orbit Analysis
- With XY proximity probes
- Shaft orbit changes through critical speeds
- Precession direction and shape evolution
- Advanced rotor dynamics characterization
Information Extracted
Critical Speed Locations
- Precise RPM where resonances occur
- First, second, third critical speeds if in range
- Verification vs. design calculations
- Separation margin assessment
Resonance Severity
- Peak amplitude indicates amplification factor
- High peaks (> 5-10× baseline) indicate low damping
- Sharp peaks more concerning than broad peaks
- Assess if vibration acceptable during transient
Damping Quantification
- Calculate from peak sharpness (Q-factor method)
- Or from decay rate in time domain
- Damping ratio typically 0.01-0.10 for machinery
- Lower damping = higher resonance peaks
Applications
New Equipment Commissioning
- First-run validation
- Verify critical speeds match predictions (±10-15%)
- Confirm adequate separation margins
- Establish baseline for future comparison
- Acceptance testing requirement
Troubleshooting High Vibration
- Determine if operating near critical speed
- Identify previously unknown resonances
- Assess effect of modifications (bearing changes, added mass)
- Compare before/after coastdowns
Periodic Health Assessment
- Annual coastdown during planned shutdowns
- Compare to commissioning baseline
- Detect critical speed shifts (indicating mechanical changes)
- Monitor damping degradation
Advantages Over Run-Up
Unpowered Deceleration
- Natural coastdown from friction and windage
- No control system complications
- Simpler execution
Slower Speed Changes
- Longer time at each speed (better data resolution)
- More data points through critical speeds
- Improved damping measurement
Hot Condition Testing
- Equipment at operating temperature
- Bearings at operating clearances
- More representative of actual operating dynamics
Practical Considerations
Safety
- Monitor vibration during coastdown
- If excessive, consider emergency stop vs. riding through
- Personnel clear of equipment
- Safety systems functional
Data Quality
- Ensure stable deceleration (not erratic)
- Adequate sampling rate for highest frequencies
- Good tachometer signal throughout
- Sufficient averages at each speed
Repeatability
- Perform multiple coastdowns for verification
- Compare results for consistency
- Variations indicate changing conditions or measurement issues
Coastdown analysis is a fundamental rotor dynamics diagnostic technique providing comprehensive characterization of machinery dynamic behavior through measurement during natural deceleration. The resulting Bode and waterfall plots reveal critical speeds, assess damping, and enable comparison to design predictions or historical baselines, making coastdown testing essential for commissioning validation, periodic condition assessment, and resonance troubleshooting in rotating equipment.
