Understanding the Vibration Analyzer


1. Definition: What is a Vibration Analyzer?
A Vibration Analyzer is an electronic instrument used to measure, store, and display detailed vibration data from machinery. It is used for in-depth vibration diagnostics when you need to understand not only “how much vibration,” but also “what exactly is happening” inside the machine.
Unlike a simple vibrometer that typically provides one overall value, a vibration analyzer captures the vibration signal and applies signal processing, most notably the Fast Fourier Transform (FFT), to break the signal into frequencies. The resulting spectrum helps identify patterns associated with faults such as unbalance, misalignment, bearing defects, and other problems.
2. What Data a Vibration Analyzer Provides
A vibration analyzer is valuable because it can show the same vibration signal in different “views.” Each view answers a different diagnostic question:
- Overall vibration level: a single integrated value across a defined frequency band, often used for quick condition checks and trending.
- Time waveform: the raw vibration signal versus time. This view is useful to understand the shape and stability of vibration and to detect non-sinusoidal behavior.
- FFT spectrum: vibration amplitude versus frequency. This is the main view used to see “what frequencies exist” and how energy is distributed.
- Running-speed component (1x): the vibration component synchronized with the rotor’s rotation speed. This is the key reference for many rotating machine diagnostics.
- Harmonics of running speed: vibration components at multiples of the rotation speed (2x, 3x, etc.). A harmonic view helps you quickly compare the contribution of several harmonics in one place.
- Speed and phase reference: many diagnostic and balancing tasks require accurate speed measurement and phase reference from a tachometer.
3. How a Vibration Analyzer Turns Measurements into Diagnostic Information
The analyzer collects the vibration signal from sensors (most often an accelerometer) and then processes it in software:
- Signal acquisition: the analyzer captures the vibration signal (time waveform) and can measure on one or multiple channels to compare different points on the same machine.
- Frequency analysis (FFT): the raw waveform is converted into a frequency spectrum using FFT to reveal discrete components and harmonics.
- Synchronous processing with tachometer: when a phase reference is used, the analyzer can extract the 1x component and build synchronized charts over one rotor revolution, which is also the basis for some harmonic views.
- Measurement setup and control: the user selects measurement parameters (frequency range, acquisition time, and other processing settings such as windowing).
4. Components of a Vibration Analysis System
A complete vibration analysis system usually includes:
- The analyzer / data collector: hardware that receives the sensor signals and provides measurement functions.
- Sensors: typically accelerometers. Depending on tasks and machine type, other sensors can also be used (for example proximity probes).
- Tachometer / phase reference: required for speed measurement and phase-related functions (1x, harmonics, balancing, synchronous measurements).
- Host software: software on a PC used to display charts, store results, compare measurements over time, and generate reports.
5. Example: Vibration Analysis Functions in Balanset-1A Software
Balanset-1A is a dual-channel, PC-based system for rotor balancing and vibration measurement. In addition to balancing functions, it provides vibration measurement and analysis tools through Vibration meter mode and Charts mode.
5.1 Vibration meter mode: digital values + wave and spectrum
In Vibration meter mode, the software displays overall vibration and the 1x vibration component (with phase when a tachometer is used). The same screen can also show the waveform and spectrum view.

5.2 Charts mode: four chart types for deeper analysis
Charts mode is used when you want graphical analysis on two channels. It provides four chart types:
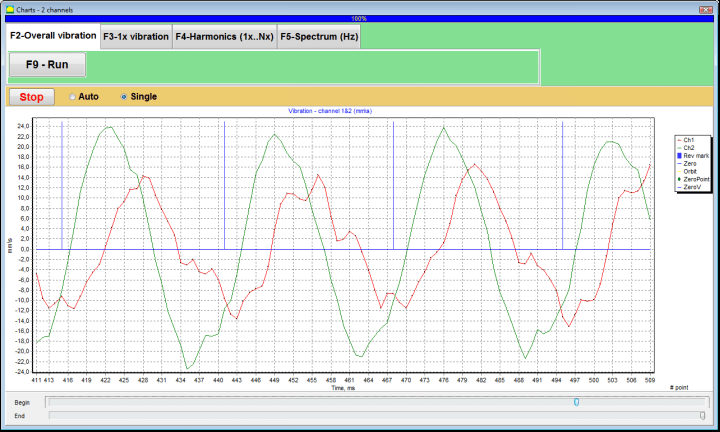
- Overall vibration time function (time waveform of overall vibration)
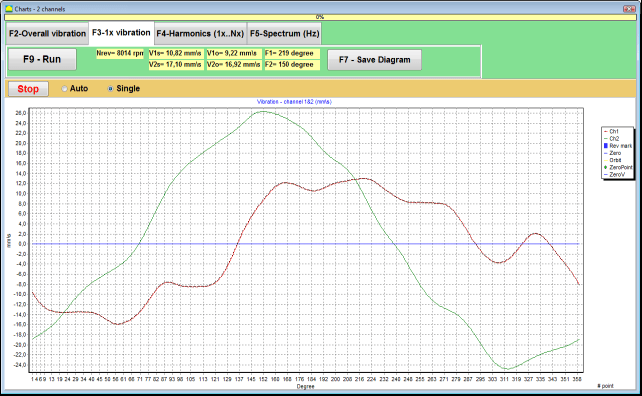
- 1x vibration charts synchronized to one rotor revolution
- Harmonics of 1x vibration (harmonic components of running speed)
- FFT spectrum (spectrum view with waveform shown above)
Overall vibration time function
This chart shows how vibration changes over time. It is useful for evaluating stability and identifying changes during the measurement interval.
1x vibration charts (synchronous view)
This view displays the 1x vibration over one rotor revolution. It is synchronized to the phase mark from the tachometer and is used when you need to analyze vibration tied to running speed.
Harmonics of 1x vibration
This view shows harmonic components related to running speed. It helps compare harmonic levels in a single chart.
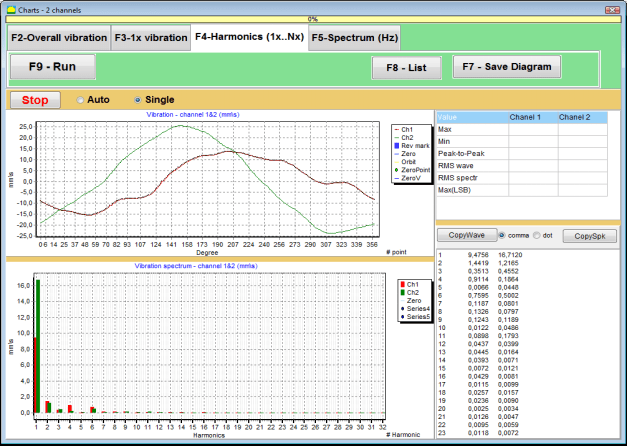
FFT spectrum view
This view shows the vibration spectrum, which is the main tool for identifying frequency components and fault signatures. The waveform is shown above the spectrum for additional context.

5.3 Typical measurement workflow (practical view)
A typical workflow in the field is straightforward:
- Install vibration sensors on the machine measurement points.
- Install the tachometer and apply reflective tape (phase mark) on the rotor when phase / 1x synchronized functions are required.
- Connect sensors to the Balanset-1A measuring unit and connect the measuring unit to a Windows laptop.
- Open Vibration meter mode for a quick check, then use Charts mode for deeper analysis (overall waveform, 1x charts, harmonics, spectrum).
- Save measurements and use them for comparison over time and reporting.
6. The Role of the Analyst
Even with a powerful analyzer, the result depends on correct measurement setup and interpretation. The analyzer provides data (waveforms, spectra, and synchronized charts), while the specialist determines what the data means for the machine’s condition and what actions are required.
