Understanding the Frequency Response Function (FRF)
1. Definition: What is a Frequency Response Function?
The Frequency Response Function (FRF) is a measure that describes how a structure, component, or system responds to an applied excitation force, as a function of frequency. In simpler terms, the FRF tells you how much a system will vibrate at each frequency when you “hit” it with a known force.
The FRF is a fundamental concept in structural dynamics, modal analysis, and resonance detection. It is essentially a transfer function that relates a measured output response (usually acceleration) to a measured input force.
FRF = Output Response / Input Force
Both the output and the input are functions of frequency, and the FRF itself is a complex function, meaning it contains both amplitude and phase information.
2. How is an FRF Measured?
An FRF is typically measured using a technique called an “impact test” or bump test:
- An accelerometer is mounted on the structure at the point where the response is to be measured.
- The structure is struck at a specific point with a special instrumented hammer. This hammer has a force sensor (a load cell) built into its tip, which measures the input force of the impact.
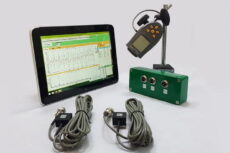
- A multi-channel vibration analyzer simultaneously records both the input signal from the hammer and the output signal from the accelerometer.
- The analyzer then performs an FFT on both signals and computes the ratio of the output to the input at each frequency line. The result is the FRF.
This process is repeated with multiple impacts, which are averaged together to produce a clean and reliable FRF measurement.
3. Interpreting an FRF Plot
An FRF is usually displayed as two plots:
- Magnitude Plot: This shows the amplitude of the FRF versus frequency. The plot will have distinct peaks, and the frequency of each peak corresponds to a natural frequency (or resonant frequency) of the structure. The height of the peak is an indicator of the amount of amplification and the level of damping at that resonance.
- Phase Plot: This shows the phase shift between the response and the input force versus frequency. As the frequency passes through a resonance, the phase plot will show a characteristic 180-degree shift. This phase shift is a definitive confirmation of a natural frequency.
4. Applications in Vibration Diagnostics
The FRF is an indispensable tool for diagnosing and solving resonance problems in machinery and structures:
- Identifying Natural Frequencies: The primary use is to precisely identify the natural frequencies of a machine, its base, connected piping, or the surrounding support structure.
- Confirming Resonance: If a machine exhibits high vibration at a specific frequency during operation, an FRF measurement can confirm if that operating frequency coincides with a structural natural frequency. If the peak in the operating spectrum matches a peak in the FRF, then resonance is confirmed as the root cause of the high vibration.
- Modal Analysis: By taking FRF measurements at many different points on a structure, a full computer model of its vibration modes (its “Operating Deflection Shapes” at resonance) can be constructed. This model can be used to design effective structural modifications.
- Structural Modification (“What If” Analysis): Once a resonance is confirmed, the modal model can be used to simulate the effect of potential fixes (like adding a stiffener or a mass) before any physical changes are made, ensuring the proposed solution will be effective.
