Balancing services › Vibration Analyzer
Vibration Analyzer — Two-Channel FFT Spectrum, Phase & Fault Diagnostics
The Balanset-1A is a two-channel vibration analyzer that plots real-time FFT spectra, measures amplitude and phase at 1× RPM, and maps fault signatures to distinguish unbalance, misalignment, looseness and bearing damage — then balances in the same session. One portable kit for €1,975 covers diagnosis, correction and verification without switching instruments.
In short: The Balanset-1A vibration analyzer captures simultaneous two-channel signals from ICP accelerometers, computes a real-time FFT spectrum, and displays amplitude and phase at every shaft-order harmonic. Unbalance appears as a dominant 1× RPM peak; misalignment as elevated 2× and 3× components; bearing defects as BPFO/BPFI sidebands; looseness as sub-harmonics. Because the same hardware and sensors are used for field balancing, you diagnose the fault, correct it, and verify the result in a single site visit — measuring vibration velocity from 0.05 to 100 mm/s across 5 to 300 Hz.
Signs your machine needs vibration analysis, not just a meter reading
A single overall vibration number tells you that something is wrong. An FFT spectrum tells you what and why. These situations call for a proper analyzer:
What the Balanset-1A analyzer measures
The analyzer captures simultaneous signals from two ICP accelerometers referenced to the laser tachometer. Every parameter listed below is available in a single acquisition run:
- Overall vibration velocity (mm/s RMS) and acceleration (m/s² or g)
- Real-time FFT frequency spectrum with user-selectable resolution
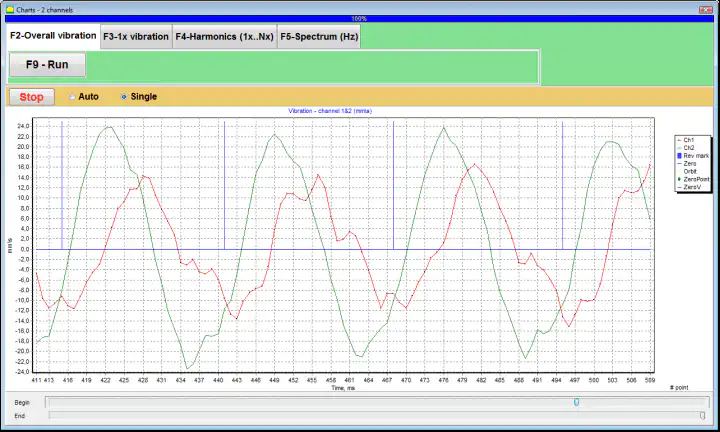
- Vibration waveform (time-domain signal) on both channels simultaneously
- Phase angle at 1× RPM relative to the shaft tachometer reference
- 1×, 2×, 3× and higher shaft-order amplitudes extracted from the FFT
- Simultaneous two-channel acquisition (both bearing planes at once)
- Running speed (RPM) from optical laser tachometer — no nameplate needed
- Vibration trend log across successive measurements
- Printable report: waveform, spectrum and numeric summary
Fault diagnostics — reading the FFT spectrum
Each mechanical fault leaves a distinct spectral fingerprint. The table below maps the most common faults to their spectral signatures so you can read the machine’s condition directly from the Balanset-1A display.
| Fault | Dominant spectral components | Other indicators |
|---|---|---|
| Rotor unbalance | Strong 1× RPM; all other orders low | Phase stable; amplitude rises with speed squared; confirmed by trial-weight test |
| Angular misalignment | Elevated 1× and 2×; sometimes 3× | Axial vibration often equals or exceeds radial; phase difference across coupling ≈180° |
| Parallel misalignment | Strong 2× RPM; 1× may also be present | High radial vibration; 180° phase shift measured across coupling in radial direction |
| Mechanical looseness | Sub-harmonics (0.5×, 0.33×) and multiple harmonics up to 10× | Broadband noise floor elevated; symptoms worsen with load |
| Rolling-element bearing wear | BPFO, BPFI, BSF or FTF defect frequencies and their harmonics | May appear before overall level rises; sidebands around defect frequencies confirm progression |
| Resonance | Large amplitude near a natural frequency, often not synchronous with RPM | Amplitude peaks at a specific speed; phase shifts by ~180° through resonance |
When the 1× component dominates, switch directly to balancing mode — the Balanset-1A uses the same measurement run as the baseline for the influence-coefficient calculation, so no time is lost.
Why a single overall number misses the fault
A vibration pen or simple RMS meter sums all frequency components into one number. Two machines can show identical overall levels yet have completely different faults — one dominated by 1× unbalance, the other by bearing defect sidebands. Without frequency resolution you are guessing at the cause and risk applying the wrong remedy. The FFT decomposes the signal so that each fault type appears as a labelled peak at its own characteristic frequency, giving you both a diagnosis and a prescription in the same measurement.
How to use the Balanset-1A as a vibration analyzer — step by step
- Mount the sensors. Attach one or both ICP accelerometers to the bearing housings using the magnetic mounts. For phase-referenced analysis, clip the laser tachometer reflective strip to the rotating shaft and aim the sensor at it (50–500 mm working range). Both channels record simultaneously.
- Start the rotor and acquire. Open the Balanset software, select Analyzer mode, and begin acquisition. The software shows live waveform, FFT spectrum and overall RMS vibration level in mm/s in real time on a standard Windows laptop.
- Read the spectrum. Identify the dominant frequency peaks. First-order amplitude and phase are displayed automatically against the tacho pulse. Consult the fault table above to match the spectral pattern to the most probable fault type.
- Compare to acceptance limits. Check the overall velocity reading against the relevant ISO 20816 zone boundary (A/B/C/D) for your machine class and power rating. Export the spectrum plot and numeric values for the maintenance report.
- If unbalance is confirmed, balance in the same session. The baseline measurement already captured serves as the first run in the influence-coefficient sequence. Add a trial weight, run again, and let the software calculate the correction — no additional instruments, no second visit.
Vibration measurement standards
ISO 20816 defines evaluation zones for vibration velocity (mm/s RMS) on non-rotating parts: Zone A (newly commissioned), B (acceptable for long-term operation), C (alarm — immediate investigation), D (danger — risk of damage). Limits vary by machine class and shaft-centre height. The Balanset-1A reports overall velocity in mm/s RMS so you can compare directly to the relevant ISO 20816 part for your machine type.
Once unbalance is identified, residual unbalance after balancing is evaluated against ISO 21940-11 G-grades (G0.4 to G40). The Balanset-1A documents the achieved residual unbalance in its printable report, giving you a verifiable record against the applicable standard. Use the residual-unbalance calculator to find the permissible tolerance before you start.
The Balanset-1A — your complete field analyzer and balancing kit
Everything on this page is done with one portable instrument: the Balanset-1A. It is a two-channel dynamic balancer and vibration analyzer that diagnoses faults from the FFT spectrum and, when unbalance is confirmed, balances rigid rotors in their own bearings, at operating speed, using the 3-run influence-coefficient method — the software calculates the exact correction mass and angle and saves a report.
What’s in the Full Kit
€1,975 · Full Kit, in stock, VAT invoice
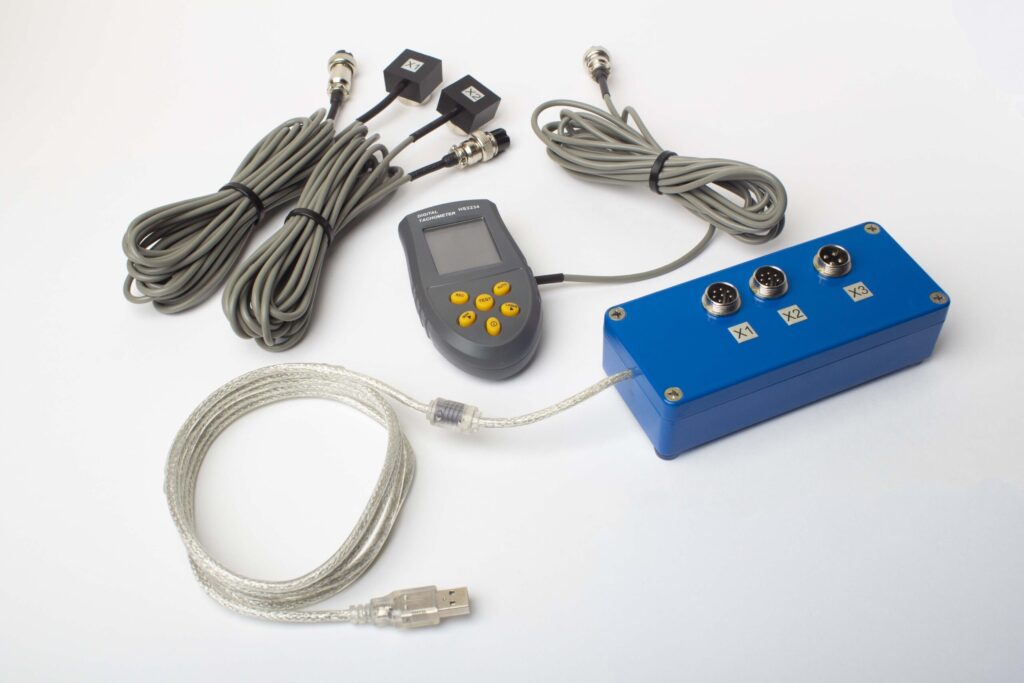
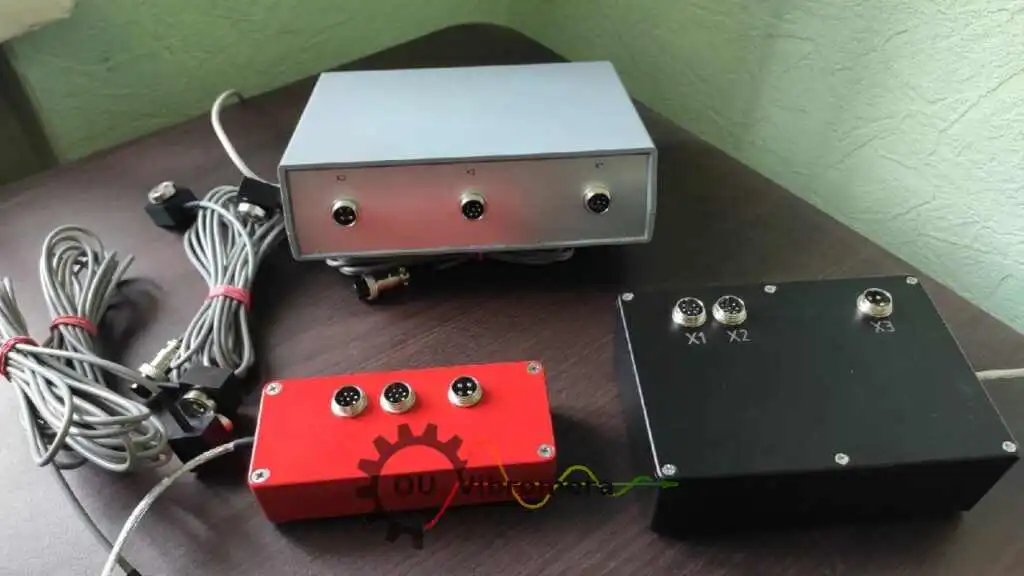
- Interface measurement unit (USB, 2 channels)
- Two vibration accelerometers (4 m cable, 10 m optional)
- Laser tachometer / optical phase sensor (50–500 mm)
- Magnetic stand for the sensor
- Digital scale for trial & correction weights
- Windows balancing & analysis software
- Plastic transport case
Full Kit
Unit · 2 sensors · laser tachometer · magnetic stand · digital scale · software · transport case. Everything needed to start analyzing and balancing out of the box.
OEM set
Unit · 2 sensors · laser tachometer · software. For integrators who already have a stand, scale and case, or who embed the unit into a balancing machine.
| Parameter | Value |
|---|---|
| Measurement channels | 2 (single- & two-plane balancing) |
| Vibration velocity range | 0.05–100 mm/s |
| Frequency range | 5–300 Hz |
| Measurement accuracy | ±5% of full scale |
| Method | 3-run influence-coefficient (1 or 2 planes) |
| Analysis | Amplitude & phase at 1×, FFT spectrum & waveform, saved reports |
| Laptop | Not included (Windows PC, available on request) |
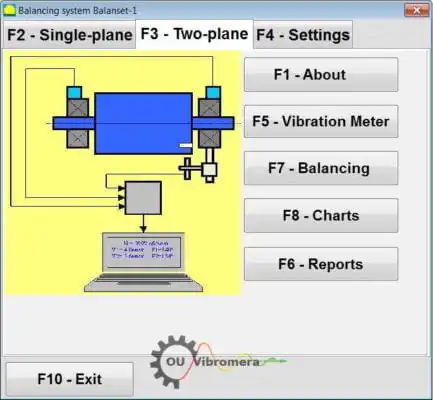
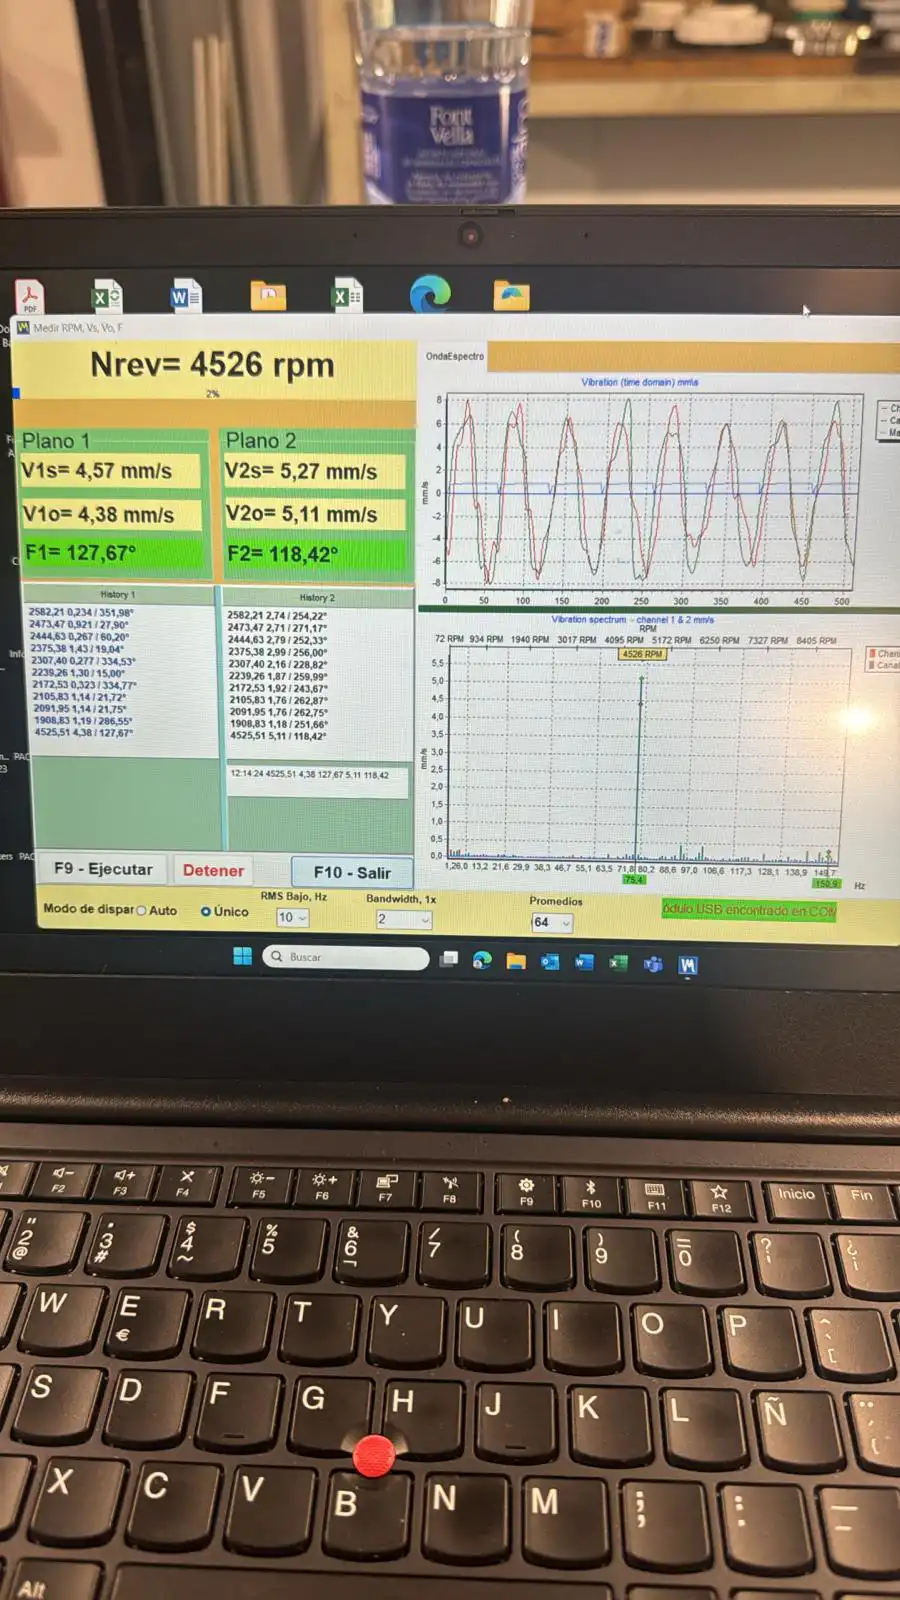
What the Balanset-1A analyzer shows
Two-channel analyzer overview
Overall vibration level, FFT spectrum and phase angle from two sensors displayed simultaneously on one Windows laptop.
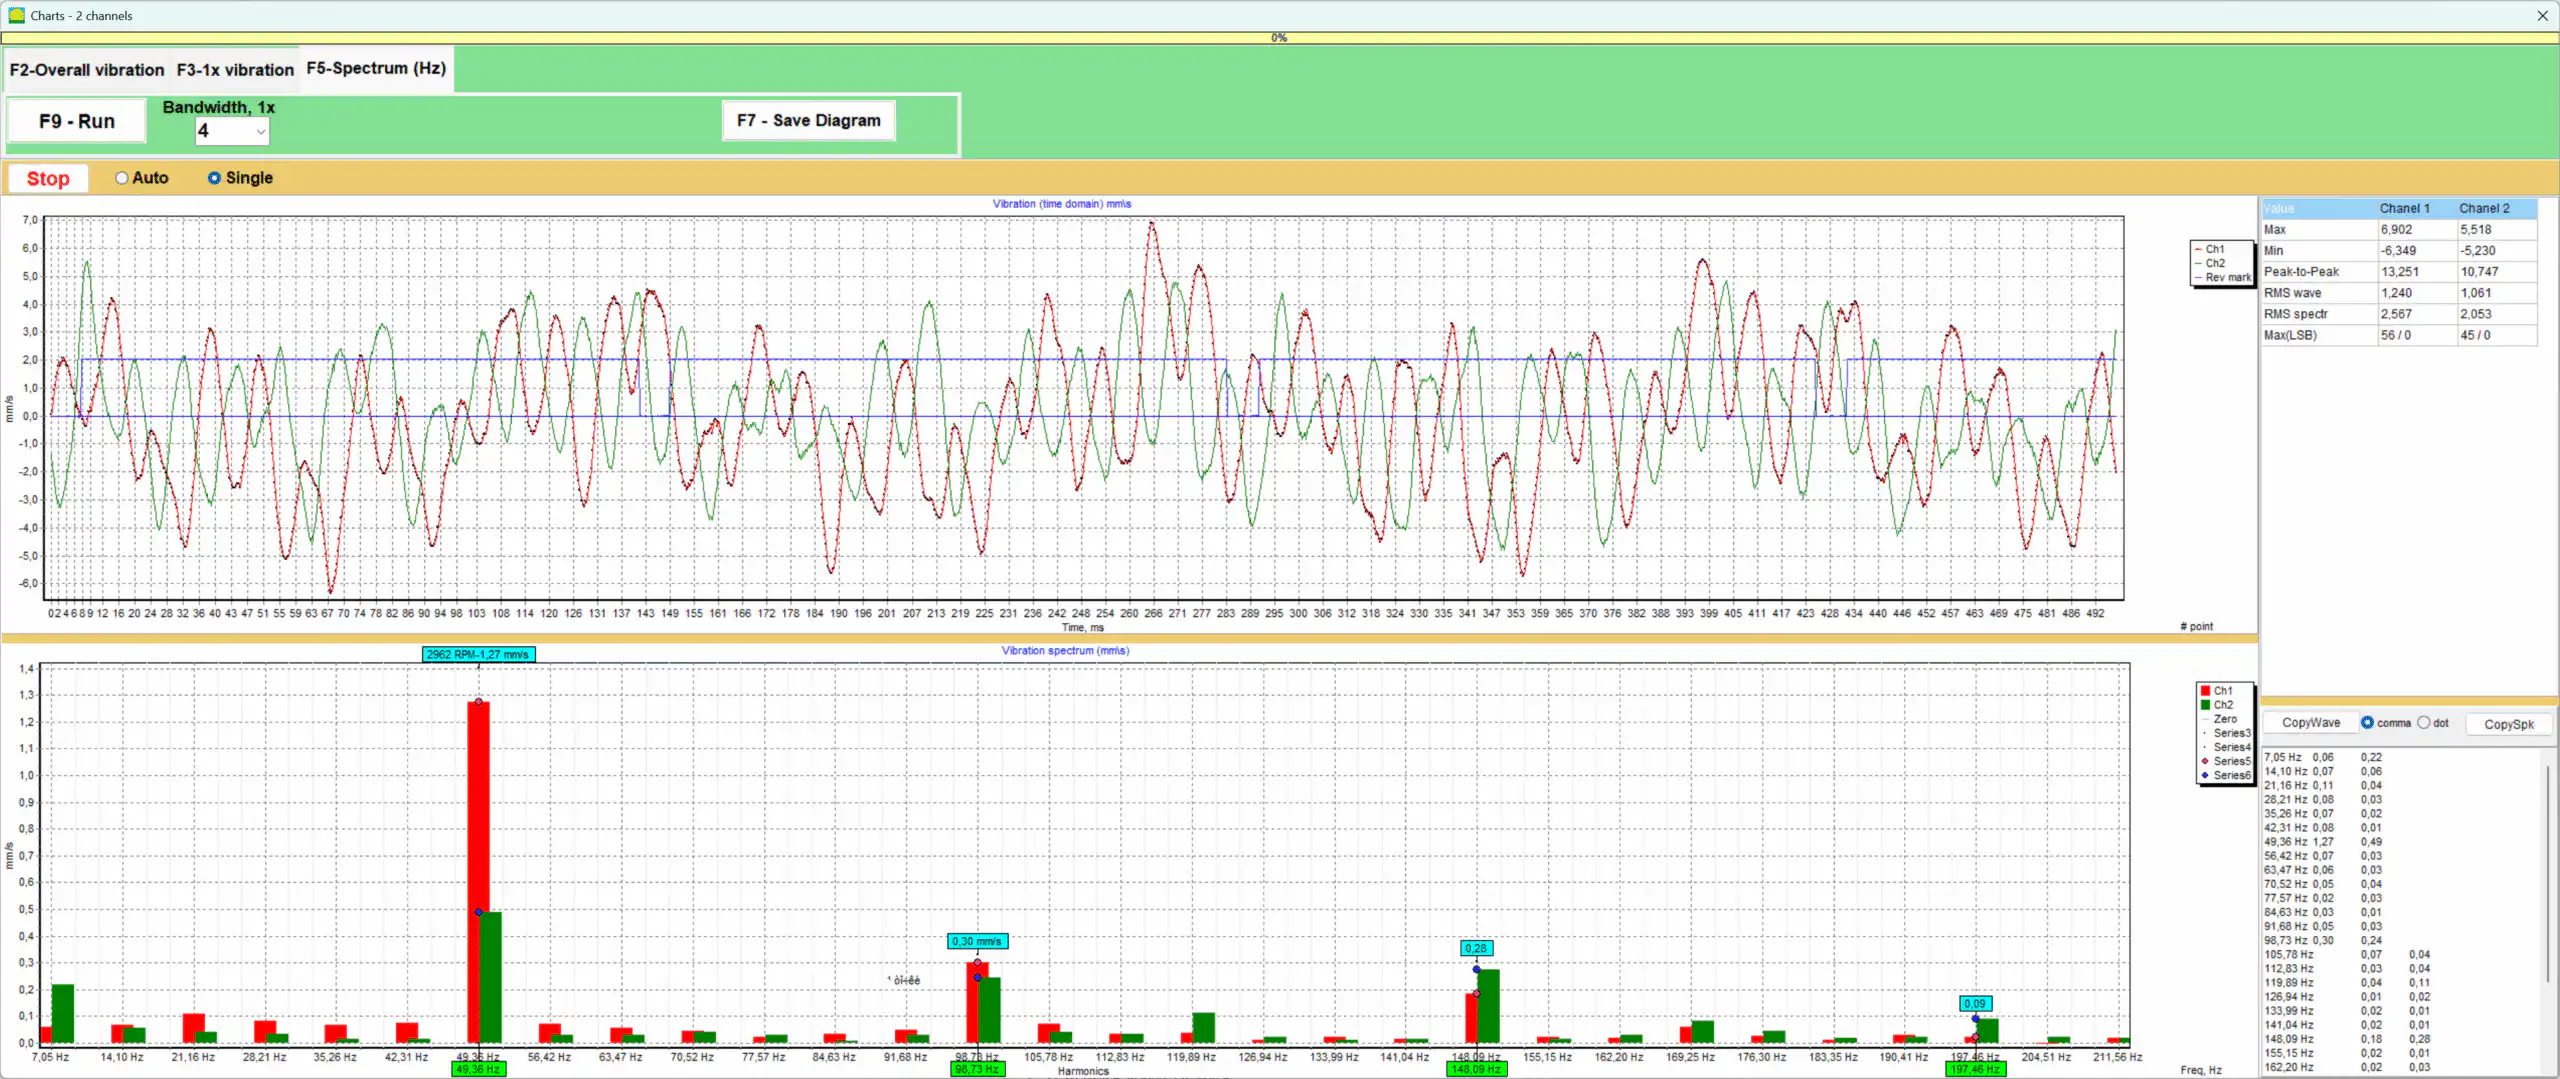
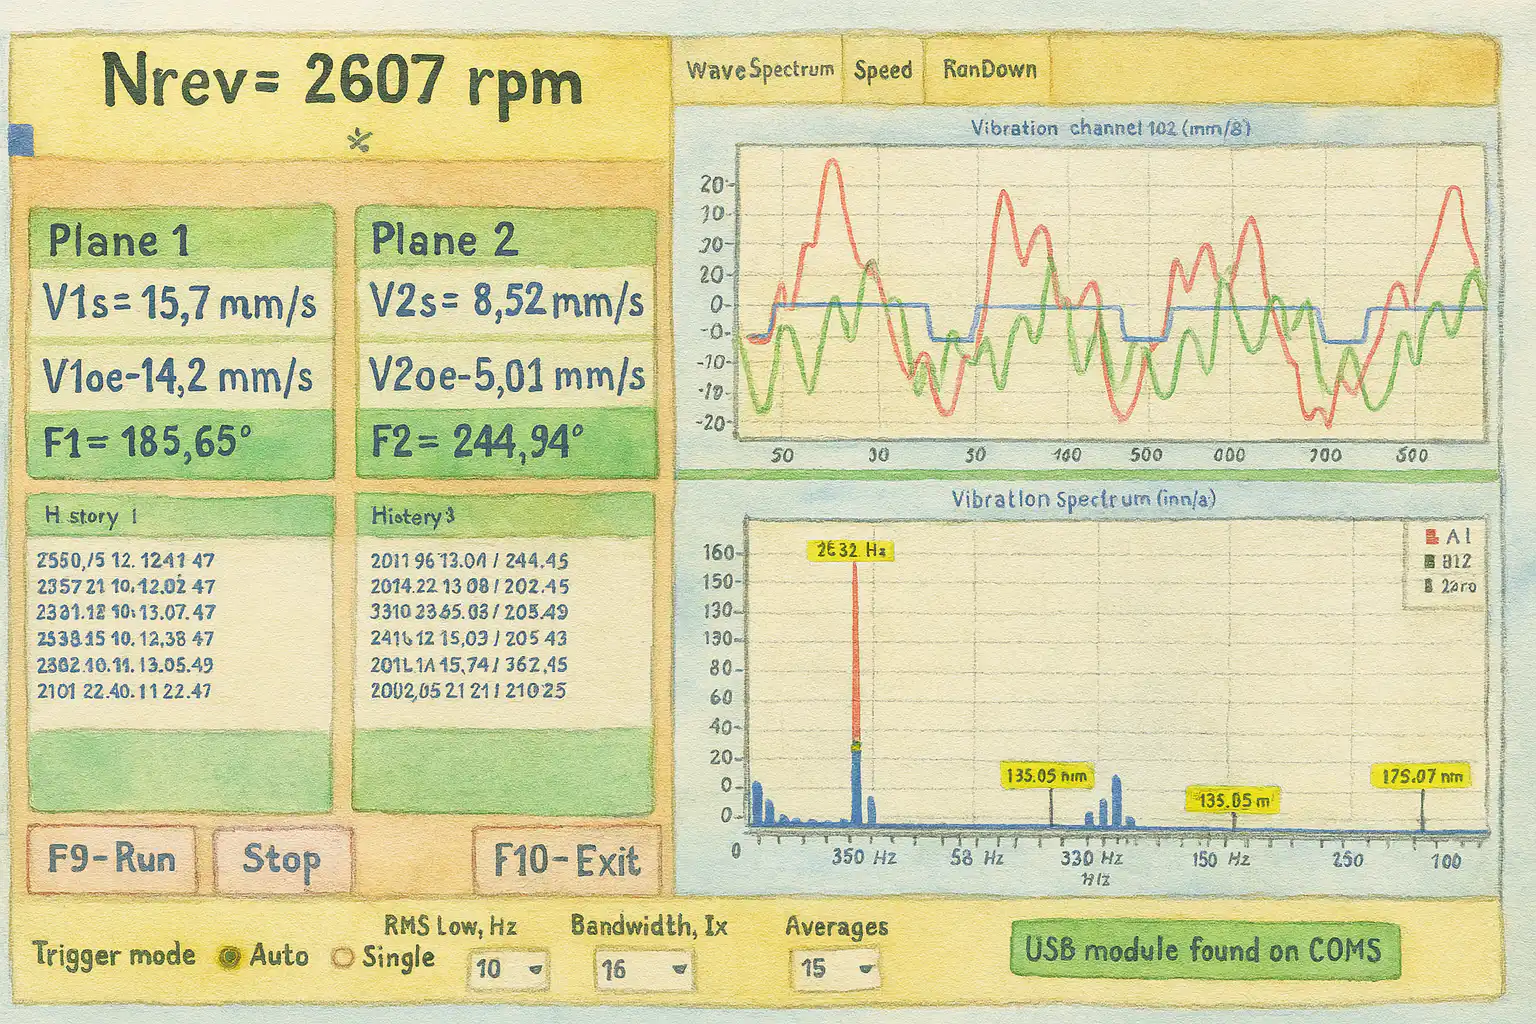
Real-time FFT spectrum
Frequency peaks distinguish unbalance (dominant 1×) from misalignment (2×) and bearing defect sidebands.
Measurement in the field
ICP accelerometer and laser tachometer mounted on a running machine’s bearing housing — no machine disassembly required.
Amplitude & phase at 1×
First-order amplitude and phase angle displayed against the tachometer reference — the inputs needed for influence-coefficient balancing.

Documented report
Waveform, FFT spectrum and numeric summary exported as a printable report for the maintenance record.
Real measurement and analyzer cases
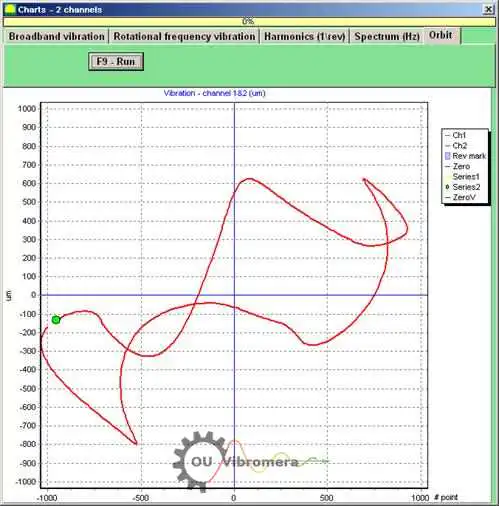
Non-contact vibration measurement
Using linear displacement sensors to measure relative rotor vibration without shaft contact — suitable for rotors where accelerometer mounting is impractical.
Analyzer and balancer combined
A practical demonstration of how one device covers vibration analysis and two-plane balancing in a single job, from diagnosis to verified correction.

Diagnose before you balance
A troubleshooting guide for cases where balancing alone does not reduce vibration — and how the FFT spectrum reveals the actual root cause.
Free vibration calculators
Vibration analyzer FAQ
How does FFT analysis distinguish unbalance from misalignment?
Can I use the Balanset-1A as a standalone analyzer without balancing?
What frequency range does the FFT cover, and is it enough for bearing diagnostics?
Does ISO 20816 apply to my machine?
Is the phase measurement accurate enough for two-plane balancing?
How does the analyzer help when balancing alone did not fix the vibration?
Learn the theory
Diagnose first — then balance with confidence
The Balanset-1A gives you a two-channel FFT analyzer and a two-plane balancer in one portable kit. Read the fault from the spectrum, correct it at source, and verify to ISO 20816 — all in a single site visit for €1,975.
