Understanding the Vibration Analyzer


A vibration analyzer is an electronic instrument used to measure, store and display detailed vibration data from machinery. It is the analyst’s primary tool for in-depth vibration diagnostics — the device you reach for when you need to understand not merely how much a machine is vibrating, but what exactly is happening inside it. Where a simple vibrometer reports a single overall number, an analyzer captures the full signal and processes it — most importantly with the Fast Fourier Transform (FFT) — to break the vibration into its component frequencies.
1. Definition: What is a Vibration Analyzer?
The defining feature of an analyzer is that it transforms a raw signal into diagnostic insight. By converting a time signal into a frequency spectrum, it lets the analyst recognise the fingerprints of specific faults: unbalance at running speed, misalignment and its characteristic 2× component, bearing defects at their non-synchronous fault frequencies, and many others. The overall value tells you a machine is unwell; the spectrum tells you why. That distinction — from a single magnitude to a frequency-resolved picture — is the whole reason the instrument exists, and it is what separates condition screening from genuine diagnosis.
2. What Data a Vibration Analyzer Provides
An analyzer is valuable precisely because it can present the same vibration signal in several different “views,” each answering a different diagnostic question:
- Overall vibration level: a single integrated value across a defined frequency band, used for quick condition checks and trending.
- Time waveform: the raw signal versus time, useful for judging the shape and stability of the vibration and for spotting non-sinusoidal behaviour such as impacts or clipping.
- FFT spectrum: amplitude versus frequency — the principal view for seeing which frequencies are present and how the energy is distributed among them.
- Running-speed component (1×): the part synchronised with the rotor’s rotation, the key reference for most rotating-machine diagnostics.
- Harmonics of running speed: components at integer multiples (2×, 3×, …), compared together to weigh their relative contributions.
- Speed and phase reference: many diagnostic and balancing tasks require an accurate speed and a phase reference taken from a tachometer.
3. How a Vibration Analyzer Turns Measurements into Diagnostic Information
The analyzer takes the signal from its sensors — most often an accelerometer — and processes it in software:
- Signal acquisition: it captures the time waveform on one or more channels, so different points on the same machine can be compared directly.
- Frequency analysis (FFT): the raw waveform is converted into a spectrum with the FFT, revealing discrete components and their harmonics.
- Synchronous processing with a tachometer: given a phase reference, the analyzer extracts the 1× component and builds charts synchronised to a single rotor revolution — the same basis used for some harmonic views.
- Measurement setup and control: the user chooses the frequency range, acquisition time and processing options such as the windowing function applied before the transform.
The choices made at acquisition determine what the spectrum can resolve: the frequency span and the number of lines together fix the resolution, so closely spaced components — bearing tones near a harmonic, say — are only separable if the setup supports it. An FFT Resolution Calculator makes that trade-off between span, lines and bin width explicit before you measure.
4. Components of a Vibration Analysis System
A complete system usually comprises:
- The analyzer / data collector: the hardware that receives the sensor signals and provides the measurement functions.
- Sensors: typically accelerometers, though depending on the task and machine type other sensors are used — for instance proximity probes for direct shaft-motion measurement on fluid-film bearings.
- Tachometer / phase reference: required for speed measurement and every phase-related function (1×, harmonics, balancing, synchronous measurements).
- Host software: the application — often on a PC — that displays the charts, stores results, compares measurements over time and generates reports.
This split between a measuring unit and PC-based software is what defines a modern portable analyzer: the laptop supplies the screen, processing power and storage, so the field hardware can stay compact.
5. Example: Vibration Analysis Functions in Balanset-1A Software
Balanset-1A is a dual-channel, PC-based system for rotor balancing and vibration measurement, used by engineers in over 50 countries. Beyond its balancing functions, it provides vibration measurement and analysis through two complementary tools: Vibration meter mode and Charts mode. It is a concrete, working example of the general architecture described above — a two-channel measuring unit feeding Windows software.
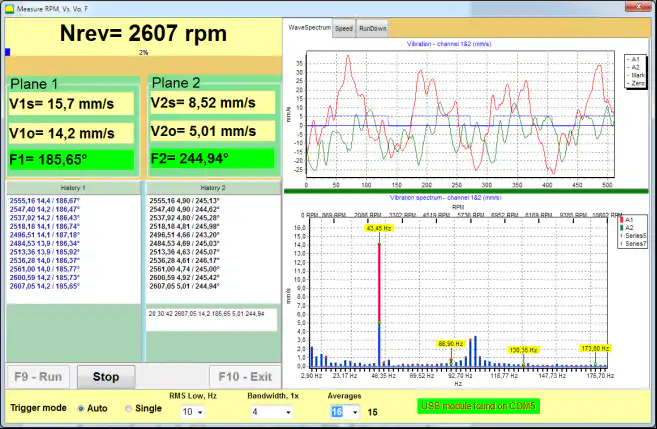
5.1 Vibration meter mode: digital values plus wave and spectrum
In Vibration meter mode the software displays the overall vibration and the 1× vibration component (with phase when a tachometer is connected). The same screen can also show the waveform and spectrum view, so a quick numerical check and a first look at the frequency content sit side by side.
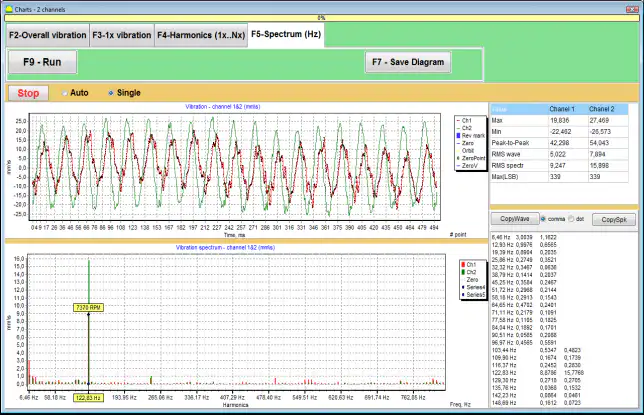
5.2 Charts mode: four chart types for deeper analysis
Charts mode is used when you want graphical analysis on two channels. It provides four chart types:
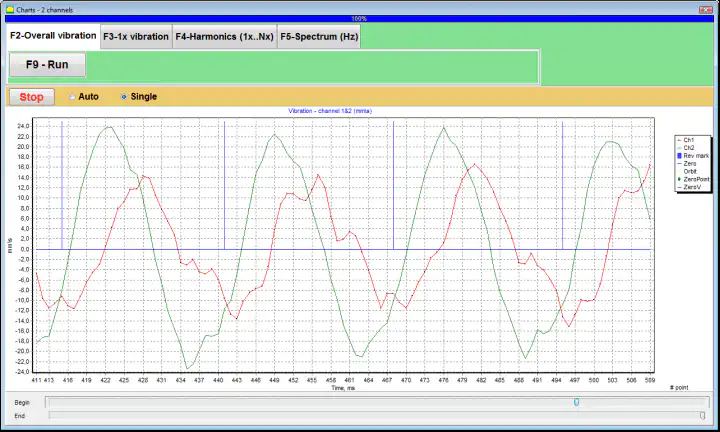
- Overall vibration time function — the time waveform of the overall vibration.
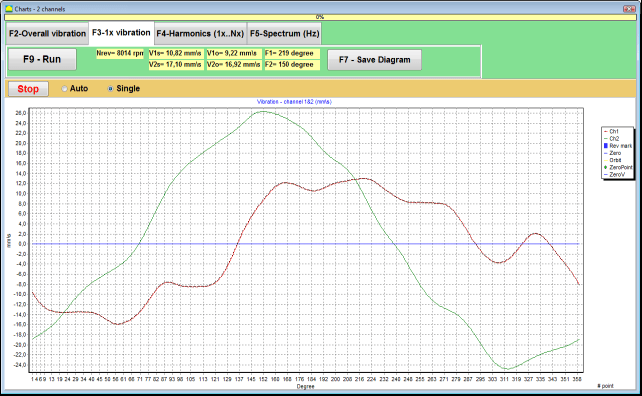
- 1× vibration charts synchronised to one rotor revolution.
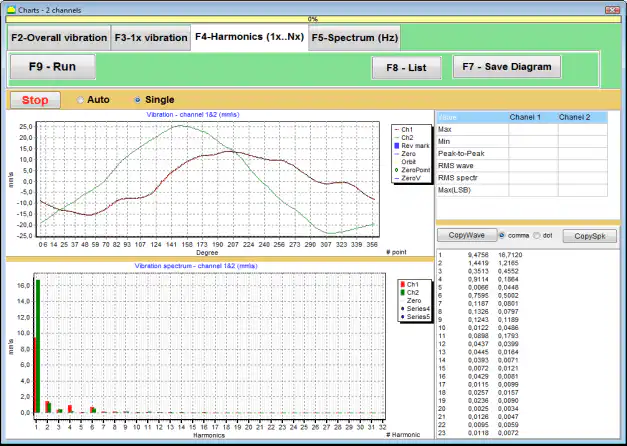
- Harmonics of 1× vibration — the harmonic components of running speed.
- FFT spectrum — the spectrum view, with the waveform shown above it.
Overall vibration time function
This chart shows how vibration changes over time. It is useful for evaluating stability and for identifying changes during the measurement interval.
1× vibration charts (synchronous view)
This view displays the 1× vibration over one rotor revolution. It is synchronised to the phase mark from the tachometer and is used when you need to analyse vibration tied to running speed — the foundation of the amplitude-and-phase data that balancing relies on.
Harmonics of 1× vibration
This view shows the harmonic components related to running speed, helping you compare harmonic levels in a single chart.
FFT spectrum view
This view shows the vibration spectrum — the main tool for identifying frequency components and fault signatures — with the waveform displayed above the spectrum for additional context. The instrument measures vibration across a span from about 5 Hz up to 1000 Hz, which comfortably covers running speed and its lower harmonics on typical industrial machines.
5.3 Typical measurement workflow (practical view)
A typical field workflow is straightforward:
- Install the vibration sensors at the machine’s measurement points.
- Install the tachometer and apply reflective tape (the phase mark) on the rotor whenever phase or 1×-synchronised functions are required.
- Connect the sensors to the Balanset-1A measuring unit and the unit to a Windows laptop.
- Open Vibration meter mode for a quick check, then switch to Charts mode for deeper analysis — overall waveform, 1× charts, harmonics and spectrum.
- Save the measurements for comparison over time and for reporting.
The same workflow underlies field balancing: the analyzer first measures the unbalance response, and after a correction weight is fitted it re-measures to confirm the result — diagnosis and correction handled with one instrument.
6. The Role of the Analyst
Even with a powerful analyzer, the result still depends on a correct measurement setup and sound interpretation. The instrument supplies the data — waveforms, spectra and synchronised charts — but it is the specialist who decides what those patterns mean for the machine’s condition and what action they call for. A clean spectrum from a poorly mounted sensor, or a textbook signature read out of context, will mislead just as surely as a wrong number. The analyzer is the microscope; the engineer is the diagnostician.
