অ-যোগাযোগ রৈখিক স্থানচ্যুতি সেন্সর ব্যবহার করে আপেক্ষিক রোটর কম্পন পরিমাপ
এর সাহায্যে Balanset-1A আপনি আপেক্ষিক পরিমাপ করতে পারেন ভাইব্রেশন এর রটার অ-যোগাযোগ রৈখিক এনকোডার ব্যবহার করে।
১.১ সেন্সর প্রকার নির্বাচন এবং সেটিং
কাজের উপর নির্ভর করে, পরিমাপের জন্য কম্পন সেন্সর বা স্থানচ্যুতি সেন্সর উভয়ই ব্যবহার করা যেতে পারে। সেন্সর প্রকার নির্বাচন করতে মূল উইন্ডোর নীচে “সেন্সর প্রকার” প্যানেলে “ভাইব্রো” বা “রৈখিক” ক্ষেত্রে একটি চিহ্ন রাখা প্রয়োজন।
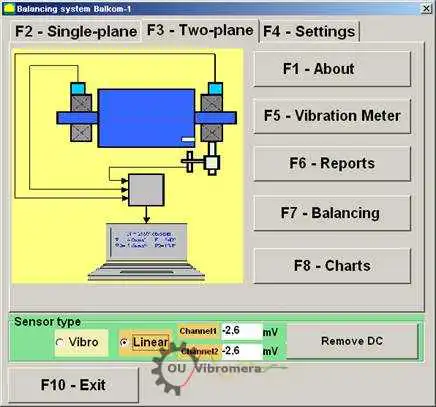
Fig. 1. Balanset program-এর প্রধান কার্যকরী উইন্ডো
measurement শুরু করার আগে নিশ্চিত হতে হবে যে sensor-এর conversion coefficient সঠিকভাবে সেট করা আছে। এজন্য program-এর main working window-এ “F4-Settings” বোতাম চাপুন (Fig. 1 দেখুন) এবং conversion coefficient প্রবেশের settings window-এ যান (Fig. 2 দেখুন)।
Fig. 2-এ দেখানো working window-তে linear ও vibration sensor-এর conversion coefficient সংশ্লিষ্ট field-এ প্রবেশ করতে হবে। এই coefficient-গুলো instrument passport-এ দেওয়া থাকে। সাধারণত এগুলো পরিবর্তন করতে হয় না।
রৈখিকের জন্য স্থানচ্যুতি Balanset-1A যন্ত্রের সেট-তে ব্যবহৃত সেন্সর, রূপান্তর গুণাঙ্ক যথাক্রমে সমান:
- Kprl1= 0.94 mV/μm (conversion coefficient of the sensor of the 1st channel);
- Kprl2 = 0.94 mV/μm (conversion coefficient of the sensor of the 2nd channel.
সঠিক operation-এর জন্য linear encoder-কে measured object-এর পৃষ্ঠ থেকে নির্দিষ্ট দূরত্বে স্থাপন করতে হবে। পৃষ্ঠ ও sensor-এর প্রান্তের মধ্যে nominal clearance হলো 3.5 mm। এ অবস্থায় sensor output-এ 2.48 volt constant voltage থাকে। এই voltage যথাক্রমে প্রথম ও দ্বিতীয় channel-এর জন্য “Channel1” এবং “Channel2” field-এ দেখা যাবে।
এটি compensation করতে “Remove DC” বোতাম চাপতে হবে। সামান্য residual offset measurement-এ বাধা দেবে না।
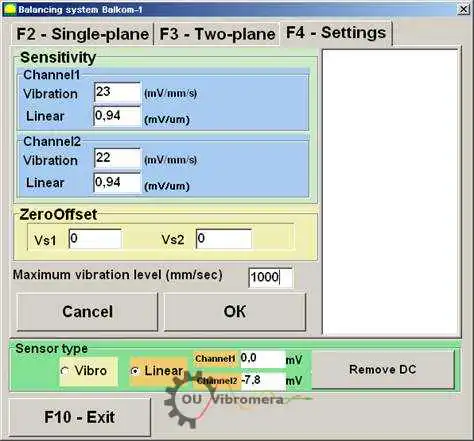
Fig. 2. conversion coefficient প্রবেশ এবং ব্যবহৃত sensor-এর ধরন নির্বাচন করার working window
সতর্কতা! নির্দিষ্ট নামমাত্র ফাঁক এবং রৈখিক এনকোডারের রূপান্তর কারণগুলি ইস্পাত দিয়ে তৈরি রোটরের জন্য দেওয়া হয়। অন্যান্য ধাতু (তামা, ব্রোঞ্জ, অ্যালুমিনিয়াম) দিয়ে তৈরি রোটরের জন্য, ব্যবহারকারীকে ক্যালিব্রেশন পরিচালনা করে পরীক্ষামূলকভাবে নামমাত্র ফাঁক এবং সেন্সর রূপান্তর গুণাঙ্ক নির্ধারণ করা উচিত।
পরিবর্তিত parameter সংরক্ষণ করতে “OK” বোতাম চাপুন। নতুন parameter file-এ সংরক্ষিত হবে এবং পরবর্তী measurement-এ ব্যবহার করা হবে।
১.২ রোটরের রেডিয়াল রানআউট পরিমাপ
রোটরের রেডিয়াল রানআউট অ-যোগাযোগ দিয়ে পরিমাপ করা যেতে পারে প্রক্সিমিটি প্রোব চিত্র ৩-এ দেখানো স্কিম অনুযায়ী দুটি সংশোধন স্তরে। সময় ফাংশন এবং রোটর রানআউট বর্ণালী পরিমাপ এবং প্লট করার জন্য, প্রয়োজনে প্রস্তুতিমূলক ক্রিয়াকলাপের একটি সংখ্যা পরিচালনা করতে হবে, যার মধ্যে রয়েছে:
- – select diametrical sections of the rotor, in which the measurements will be carried out;
- অ-যোগাযোগ রৈখিক স্থানচ্যুতি সেন্সর ৫ এবং ৬ এবং ইনস্টল করতে ফেজ কোণ সেন্সর ৭ মেশিন বেডে বিশেষ ডিভাইস ব্যবহার করে (যেমন চৌম্বক ট্রাইপড);
- – connect proximity sensors of linear motion to connectors X1 and X2, and phase angle sensor to connector X3 of the measuring unit;
- – set a nominal measuring gap ∆ between the rotor surface and the sensing element for each linear encoder (for the rotor made of steel ∆ = 3.5 mm);
- – place on the rotor the reflective mark required for triggering for the phase angle sensor 7 and check the sensor triggering;
- পরিমাপ ইউনিটটি কম্পিউটারের সাথে সংযুক্ত করুন।
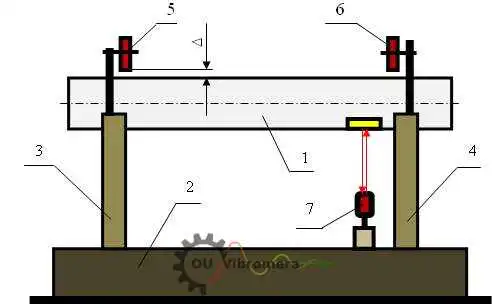
Fig. 3. রটারের radial run-out পরিমাপ
main working window-এ (Fig. 1 দেখুন) “F8 – Charts” বোতাম চাপলে computer display-তে “Graphs” working window (Fig. 5 দেখুন) দেখা যায়, যা rotor-এর radial run-out-এর বিভিন্ন ধরনের গ্রাফ তৈরির জন্য ব্যবহৃত হয়।
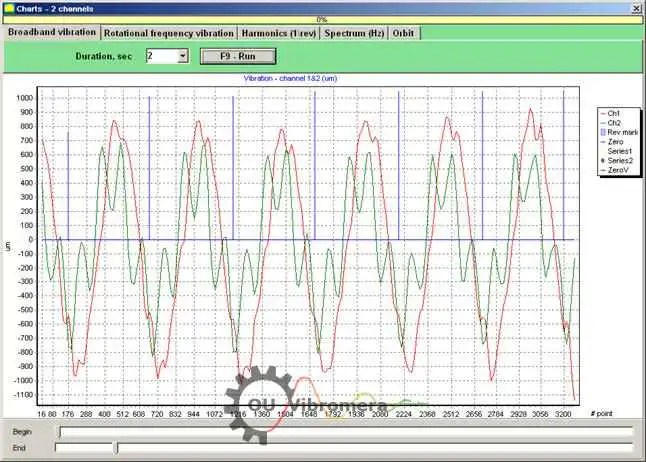
চিত্র 5. "চার্ট" মোডের কার্যকারী উইন্ডো
এই উইন্ডোতে বোতাম নিম্নলিখিত গ্রাফগুলি তৈরি করে:
- এই window-তে “Broadband vibration” বোতাম চাপলে rotor radial runout-এর time function প্রদর্শিত হয়।
- “Rotation frequency vibration” বোতাম চাপলে rotor radial runout-এর reciprocal component-এর time function প্রদর্শিত হয়।
- If you press the button “Harmonics (1/rev)”, the display will show a decomposition graph of the rotor runout into a harmonic series. The first harmonic corresponds to the value of vibration at the reverse rotor frequency (1x), the second one – at the double frequency (2x), etc.
- “Spectrum (Hz)” বোতাম চাপলে display-তে rotor-এর radial run-out-এর spectrum দেখা যায়।
- “Orbit” বোতাম চাপলে rotor orbit (precession)-এর গ্রাফ প্রদর্শিত হয়।
১.३ রোটর অরবিট গ্রাফ নির্মাণ
Fig. 6-এ দেখানো স্কিম অনুযায়ী rotor orbit গ্রাফ তৈরি করা যায়।
Fig. 6. rotor orbit measurement-এর স্কিম 1a – rotor (end view); 1b – rotor (side view); 2, 3 – non-contact sensor; 4 – phase angle sensor-এর reflection mark।
measurement নিয়ে সংশ্লিষ্ট গ্রাফ তৈরি করতে কয়েকটি প্রস্তুতিমূলক কাজ করতে হবে, যার মধ্যে রয়েছে:
- – install the non-contact linear encoders 2 and 3 in one of the diametrical sections of the rotor at an angle of 90° to each other, provided that the measuring axis of encoder 2 must coincide with the X axis, and the measuring axis of encoder 3 must coincide with the Y axis;
- rotor surface এবং প্রতিটি linear encoder-এর sensing element-এর মধ্যে nominal measuring gap ∆x (∆y) সেট করুন (steel-এর জন্য ∆ = 3.5 mm);
- – set the phase angle sensor (not shown in the scheme) in the X – Z plane, coinciding with the installation plane of non-contact sensor 2;
- – set a reflective mark 4 on the rotor 1 in the X – Z plane, which is necessary for the phase angle sensor operation;
- – connect non-contact linear encoders 2 and 3 to connectors X1 and X2, and phase angle encoder to connector X3 of the measuring unit;
- পরিমাপ ইউনিটটি কম্পিউটারের সাথে সংযুক্ত করুন।
রোটর অরবিট পরিমাপ শুরু করতে, মূল কর্ম উইন্ডোতে (চিত্র ১ দেখুন) “F8 – চার্ট” বোতাম টিপুন এবং কর্ম উইন্ডোতে “গ্রাফ” যান (চিত্র ৫ দেখুন), যা রোটরের রেডিয়াল রানআউটের বিভিন্ন ধরনের গ্রাফ তৈরি করার জন্য ডিজাইন করা হয়েছে। এই কর্ম উইন্ডোতে আপনাকে অবশ্যই “অরবিট” বোতাম টিপতে হবে, যার পরে কম্পিউটার প্রদর্শনে একটি কর্ম উইন্ডো প্রদর্শিত হয়, যেখানে প্রয়োজনীয় পরিমাপ চক্র করা হয় (চিত্র ৭ দেখুন)।
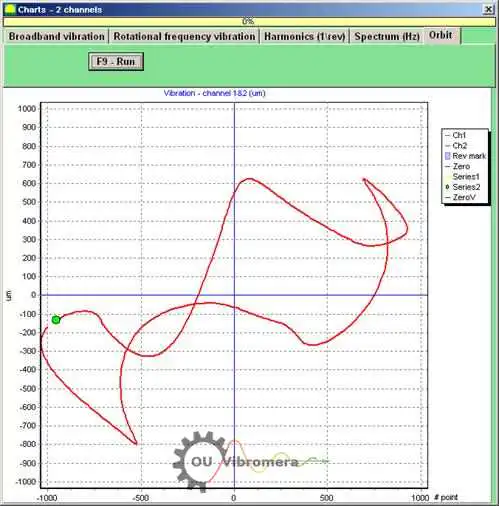
Fig.7. rotor orbit-এর গ্রাফ। Balanset software।
নির্দিষ্ট working window-এ কাজ চালিয়ে যেতে (Fig. 7 দেখুন) আপনাকে rotor rotation চালু করতে হবে এবং “F9 – RUN” button চাপ দিয়ে rotor-এর radial run-out-এর instantaneous value Sxi এবং Syi এক rotor revolution-এর সমান সময়ের জন্য পরিমাপ করতে হবে।
পরিমাপের সময় প্রাপ্ত instantaneous value Sxi এবং Syi-এর array নিয়ন্ত্রিত rotor-এর orbit plot করতে ব্যবহৃত হয় (orbit-এর প্রতিটি i-th point-এর স্থানাঙ্ক Sxi, Syi)। Instantaneous radial displacement magnitude নিম্নোক্ত formula দ্বারা নির্ণয় করা হয়:
S∑i = √ (Sxi² + Syi²) (1)
যেখানে S∑i হলো radial displacement magnitude-এর instantaneous value (rotor orbit-এর radius vector-এর দৈর্ঘ্য), যা graph-এর i-th point-এর জন্য গণনা করা হয়;
- Sxi – i-th point-এ sensor 2 (Fig. 6 দেখুন) দিয়ে X axis বরাবর পরিমাপ করা rotor-এর radial run-out-এর instantaneous value;
- Syi – i-th point-এ sensor 3 (Fig. 6 দেখুন) দিয়ে Y axis বরাবর পরিমাপ করা rotor radial run-out-এর instantaneous value।