Understanding Acceleration in Vibration Analysis




Acceleration is the rate of change of an object’s velocity with respect to time. In vibration analysis it is one of the three core measurement parameters, quantifying how quickly the velocity of a vibrating component is changing. Where displacement tells you how far a part moves and velocity tells you how fast, acceleration is really a measure of the forces acting on the part — which makes it acutely sensitive to high-frequency events such as impacts and abrupt changes in motion.
1. Definition: What Is Vibration Acceleration?
Mathematically, acceleration is the first time-derivative of velocity and the second derivative of displacement. For a body vibrating sinusoidally at frequency f, the acceleration amplitude scales with the square of frequency for a fixed displacement — doubling the frequency quadruples the acceleration. That single fact explains why acceleration is the natural language for fast, sharp events: the higher the frequency content of a fault, the more it stands out in an acceleration signal. It is also why an analyst chooses acceleration when the phenomena of interest live in the kilohertz region rather than near running speed.
2. Why Is Acceleration Measurement Important?
Measuring acceleration is central to a thorough condition monitoring programme because it excels at catching faults that gentler parameters can miss. Its importance rests on a few key factors:
- High-frequency fault detection: acceleration is inherently more sensitive to high-frequency vibration, making it the ideal parameter for early-stage rolling-element bearing damage, gear-mesh problems and blade-pass excitation, all of which radiate energy high in the spectrum.
- Direct relationship to force: by Newton’s second law (Force = Mass × Acceleration), acceleration is directly proportional to the dynamic forces inside a machine. Reading acceleration therefore gives a direct window onto the forces that drive stress and fatigue in components.
- Wide dynamic range: the accelerometers used to capture it span a very wide range of frequencies and amplitudes, making them versatile across many machine types and speeds.
3. Units and Measurement
Common Units
Vibration acceleration is usually expressed in one of two units:
- g: a unit referenced to the acceleration of Earth’s gravity, where 1 g ≈ 9.81 m/s². The g is popular because it gives a standardised, intuitive sense of how hard a part is being shaken.
- m/s² (or mm/s²): the SI unit, metres per second squared, preferred for formal reporting and calculation.
It is worth being explicit about whether a figure is peak, true-peak or RMS, since the same vibration can be quoted three ways. Converting between g, m/s² and the velocity or displacement equivalents at a given frequency is exactly what our Vibration Acceleration Calculator is for.
How Is It Measured?
Acceleration is almost exclusively measured with an accelerometer — a transducer that converts the mechanical force of vibration into a proportional electrical signal. The piezoelectric accelerometer is the most common type in industrial condition monitoring, prized for its ruggedness, accuracy and wide, flat frequency response. Its output can be analysed directly or, through electronic integration, presented as velocity or displacement instead.
4. Practical Applications in Diagnostics
In day-to-day diagnostics, acceleration data pins down specific problems:
- Bearing faults: microscopic defects on races, rollers and balls generate small, high-frequency impact spikes. Acceleration measurements — especially combined with envelope analysis to demodulate them — are the primary route to catching these faults at their earliest, most actionable stage, often by tracking the bearing fault frequencies.
- Gearbox analysis: the high-frequency content from tooth meshing, plus the impacts from cracked or chipped teeth, shows up clearly in the acceleration spectrum, frequently right at the gear-mesh frequency and its sidebands.
- High-speed machinery: for turbines and high-speed compressors the dominant frequencies sit in the band where acceleration is most sensitive, so it is often the preferred overall measurement.
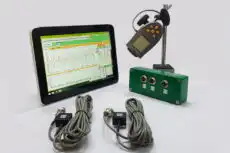
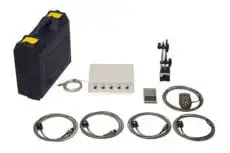
This same versatility is what lets a portable two-channel instrument like the Balanset-1A serve as both a balancing tool and a diagnostic one: it acquires acceleration from its sensors, integrates to velocity for severity checks against ISO 20816 (the modern replacement for ISO 10816), and uses the same channels to measure 1× amplitude and phase for field balancing.
5. Relationship to Velocity and Displacement
Displacement, velocity and acceleration are mathematically linked by integration and differentiation. For a simple sinusoidal vibration, velocity is the integral of acceleration and displacement is the integral of velocity; conversely, differentiation moves the other way. The practical upshot is that, for the same vibrational energy, acceleration amplitudes are naturally largest at high frequencies while displacement amplitudes dominate at low frequencies — with velocity sitting in between and staying relatively flat across the mid-band. That is precisely why analysts pick the parameter best matched to the frequency range of the expected fault: displacement for slow shaft motion, velocity for general machinery health, and acceleration for the fast, force-driven events of bearings and gears.
6. What the Balanset-1A shows about acceleration
The Balanset-1A picks up vibration with MEMS accelerometers and reports vibration velocity in mm/s RMS, and its spectrum can be viewed in velocity or in acceleration. Comparing the two views is a quick check of where the vibration energy sits before you decide to balance.
- Mount both sensors radially on a rigid part of the bearing housings, with the whole face of the magnet in contact. Do not put them on guards, covers or the end face. Fit and move the sensors only with the machine stopped and locked out.
- Open the Vibration Meter (F5) and stay on the Wave Spectrum tab. Compare V1s with V1o. If the 1× component is close to the overall value, the vibration is mostly unbalance. If it is much smaller, most of the energy is in harmonics and noise.
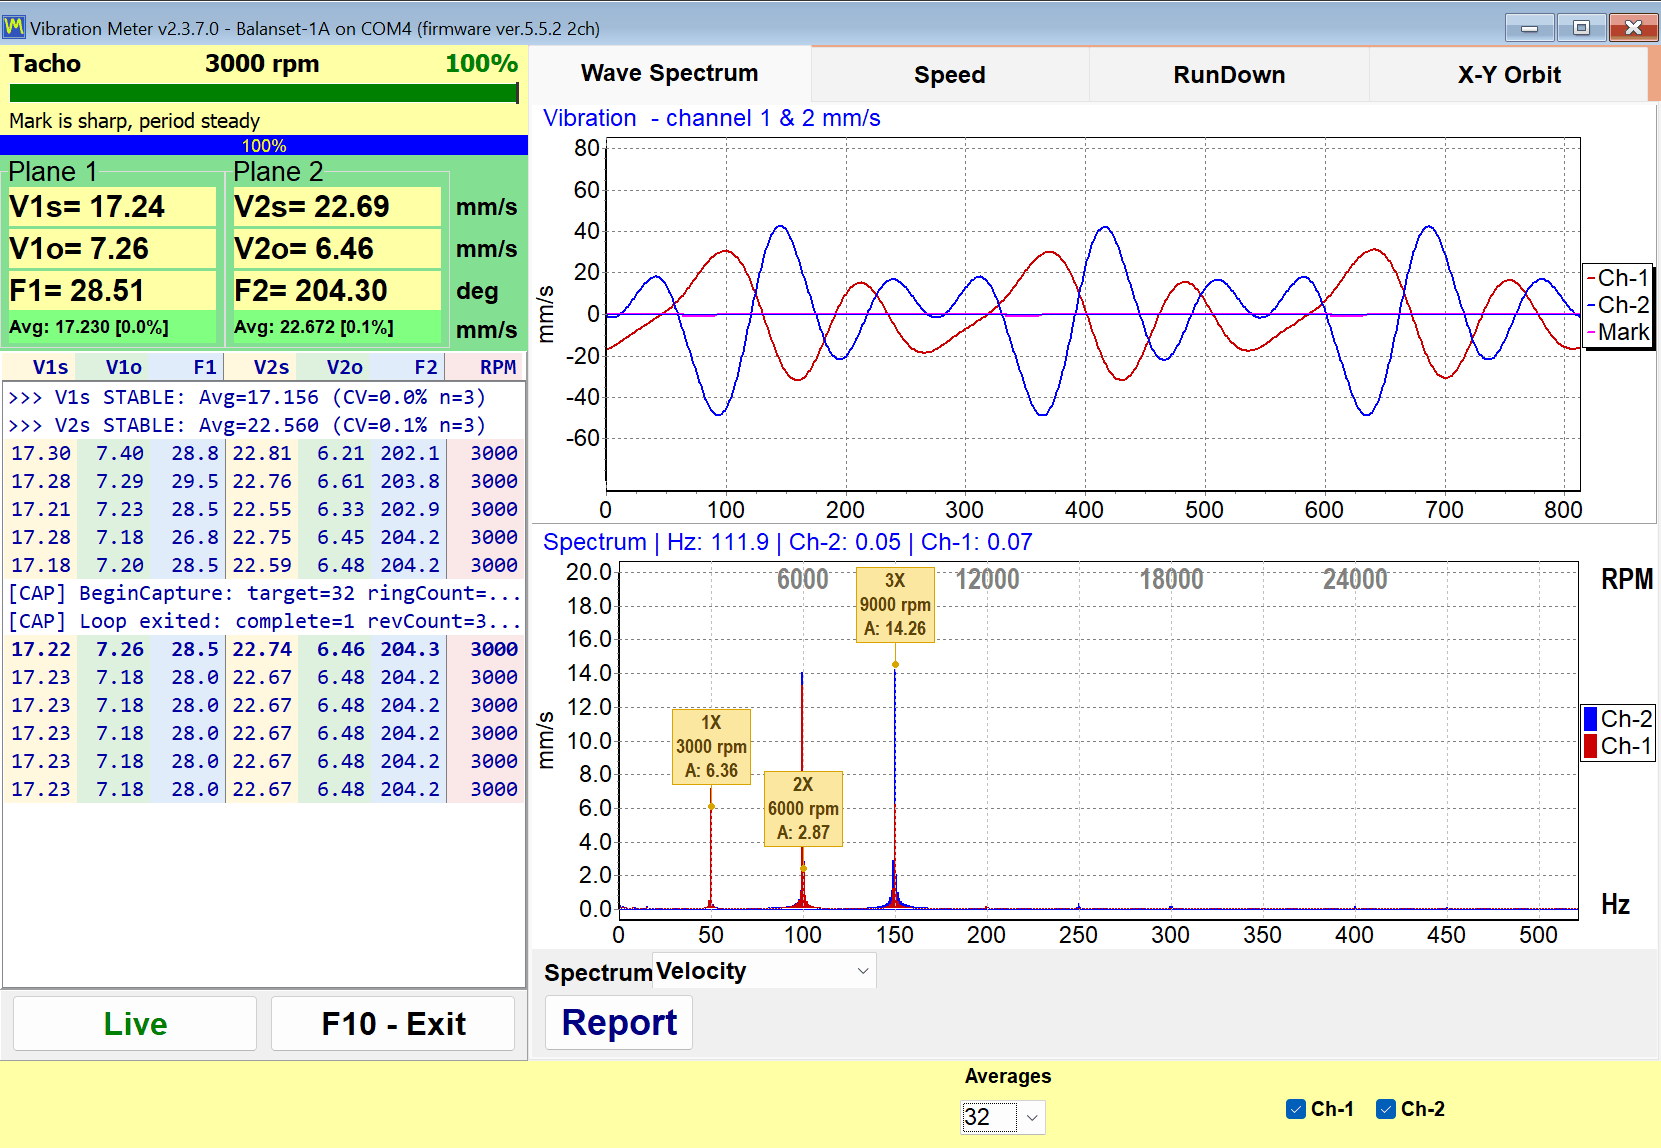
- Switch the Spectrum selector below the chart from Velocity to Acceleration (m/s2). Acceleration gives more weight to higher frequencies, so peaks at 2×, 3× and above grow relative to 1×. For the same velocity, 3× shows three times the acceleration of 1×: at 3000 rpm, 1 mm/s RMS is about 0.31 m/s2 at 1× (50 Hz) and 0.94 m/s2 at 3× (150 Hz). Hover the cursor over a peak to read its frequency and amplitude in the chart title.
- Judge severity on the velocity readings, because the ISO vibration zones are given in mm/s. To colour V1s and V2s by zone, select a Vibration evaluation standard on the F4 – Settings tab of the main window.
- If 1× is the largest peak in the velocity view and V1o is close to V1s, go on to balancing. If 2× or 3× peaks reach the size of 1× in the velocity view, check alignment, bearings and fastening first, then balance. A peak that is large only in the acceleration view is enlarged by its frequency; check it in the velocity view before acting.