Working in the “Charts” mode begins from the Initial window (see. Fig. 7.1) by pressing “F8 – Charts”. Then opens a window “Measurement of vibration on two channels. Charts” (see. Fig. 7.19).

Fig. 7.47. Operating window “Measurement of vibration on two channels. Charts”.
While working in this mode it is possible to plot four versions of vibration chart.
The first version allows to get a timeline function of the overall vibration (of vibration velocity) on the first and second measuring channels.
The second version allows you to get graphs of vibration (of vibration velocity), which occurs on rotation frequency and its higher harmonical components.
These graphs are obtained as a result of the synchronous filtering of the overall vibration time function.
The third version provides vibration charts with the results of the harmonical analysis.
The fourth version allows to get a vibration chart with the results of the spectrum analysis.
To plot a overall vibration chart in the operating window “Measurement of vibration on two channels. Charts” it is necessary to select the operating mode “overall vibration” by clicking the appropriate button. Then set the measurement of vibration in the box “Duration, in seconds,” by clicking on the button «▼» and select from the drop-down list the desired duration of the measurement process, which may be equal to 1, 5, 10, 15 or 20 seconds;
Upon readiness press (click) the “F9-Measure” button then the vibration measurement process begins simultaneously on two channels.
After completion of the measurement process in the operating window appear charts of time function of the overall vibration of the first (red) and the second (green) channels (see. Fig. 7.47).
On these charts time is plotted on X-axis and the amplitude of the vibration velocity (mm/sec) is plotted on Y-axis.
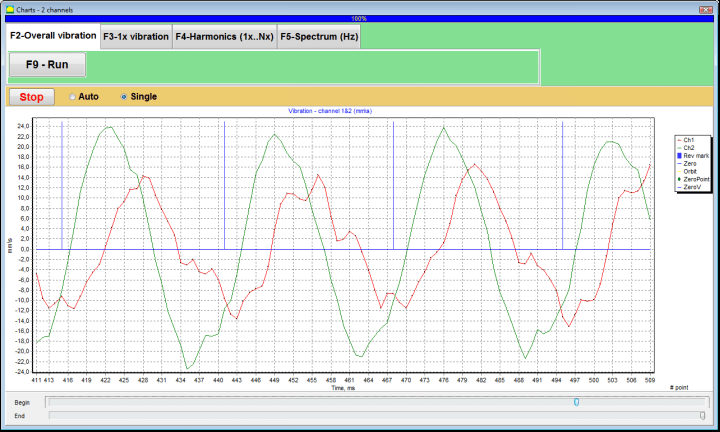
Fig. 7.48. Operating window for the output of the time function of the overall vibration charts
There are also marks (blue-colored) in these graphs connecting charts of overall vibration with the rotation frequency of the rotor. In addition, each mark indicates beginning (end) of the next revolution of the rotor.
In need of the scale change of the chart on X-axis the slider, pointed by an arrow on fig. 7.20, can be used.
To plot a 1x vibration chart in the operating window “Measurement of vibration on two channels. Charts” (see Fig. 7.47) it is necessary to select the operating mode “1x vibration” by clicking the appropriate button.
Then appears operating window “1x vibration” (see Fig. 7.48).
Press (click) the “F9-Measure” button then the vibration measurement process begins simultaneously on two channels.
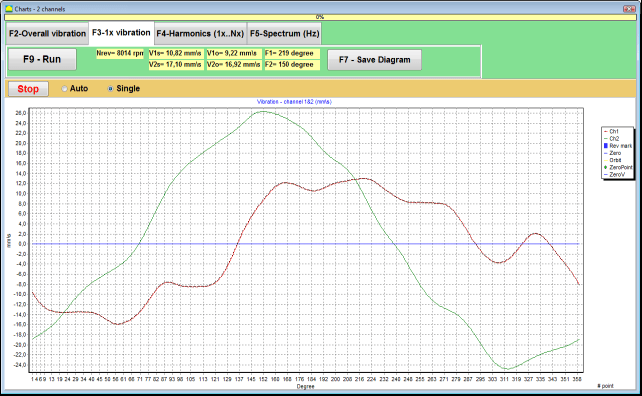
Fig. 7.49. Operating window for the output of the 1x vibration charts.
After completion of the measurement process and mathematical calculation of results (synchronous filtering of the time function of the overall vibration) on display in the main window on a period equal to one revolution of the rotor appear charts of the 1x vibration on two channels.
In this case, a chart for the first channel is depicted in red and for the second channel in green. On these charts angle of the rotor revolution is plotted (from mark to mark) on X-axis and the amplitude of the vibration velocity (mm/sec) is plotted on Y-axis.
In addition, in the upper part of the working window (to the right of the button “F9 – Measure”) numerical values of vibration measurements of both channels, similar to those we get in the “Vibration meter” mode, are displayed.
In particular: RMS value of the overall vibration (V1s, V2s), the magnitude of RMS (V1o, V2o) and phase (Fi, Fj) of the 1x vibration and rotor speed (Nrev).
To plot a chart with the results of harmonical analysis in the operating window “Measurement of vibration on two channels. Charts” (see Fig. 7.47) it is necessary to select the operating mode “Harmonical analysis” by clicking the appropriate button.
Then appears an operating window for simultaneous output of charts of temporary function and of spectrum of vibration harmonical aspects whose period is equal or multiple to the rotor rotation frequency (see Fig. 7.49).
Attention!
When operating in this mode it is necessary to use the phase angle sensor which synchronizes the measurement process with the rotor frequency of the machines to which the sensor is set.
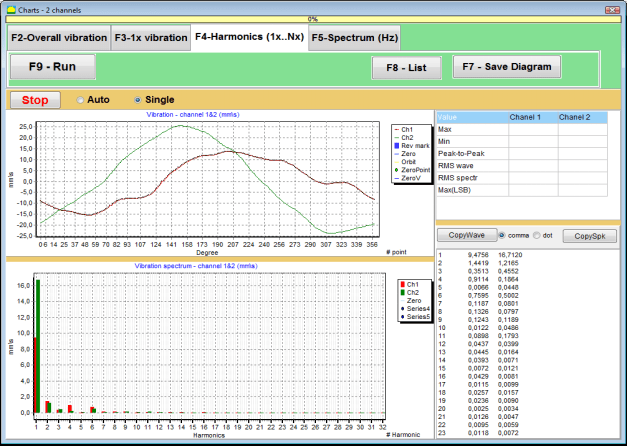
Fig. 7.50. Operating window harmonics of 1x vibration.
Upon readiness press (click) the “F9-Measure” button then the vibration measurement process begins simultaneously on two channels.
After completion of the measurement process in operating window (see Fig. 7.49) appear charts of time function (higher chart) and harmonics of 1x vibration (lower chart).
The number of harmonic components is plotted on X-axis and RMS of the vibration velocity (mm/sec) is plotted on Y-axis.

Fig. 7.51. Operating window for the output of the spectrum of vibration .
Upon readiness press (click) the “F9-Measure” button then the vibration measurement process begins simultaneously on two channels.
After completion of the measurement process in operating window (see Fig. 7.50) appear charts of time function (higher chart) and spectrum of vibration (lower chart).
The vibration frequency is plotted on X-axis and RMS of the vibration velocity (mm/sec) is plotted on Y-axis.
In this case, a chart for the first channel is depicted in red and for the second channel in green.