ಭ್ರಮಣ ಯಂತ್ರೋಪಕರಣ ವಿಶ್ಲೇಷಣದಲ್ಲಿ ಕೋಸ್ಟ್ಡೌನ್ ಅನ್ನು ಅರ್ಥಮಾಡಿಕೊಳ್ಳುವುದು





ಕೋಸ್ಟ್ಡೌನ್ — also called rundown or deceleration — is the process of letting a rotating machine slow from operating speed to a stop with no active braking, relying on the natural losses of friction, windage, and bearing drag. In rotor dynamics and vibration analysis, a coastdown ಪರೀಕ್ಷೆ is a diagnostic procedure in which vibration data is recorded continuously as the machine decelerates, yielding rich information about ನಿರ್ಣಾಯಕ ವೇಗ, ನೈಸರ್ಗಿಕ ಆವೃತ್ತಿಗಳನ್ನು, and the system’s dynamic character. Together with its mirror-image, the runup test, it is a foundational tool for commissioning new equipment, troubleshooting stubborn vibration, and validating rotordynamic models against the machine as actually built and installed.
1. Purpose and Applications
Critical-Speed Identification
The headline use of coastdown testing is locating critical speeds:
- as speed falls through each critical speed, the vibration amplitude peaks;
- peaks in the amplitude-versus-speed plot mark the critical speeds;
- an accompanying 180° phase shift confirms it is true resonance rather than another speed-related effect; and
- several critical speeds can be captured in a single run.
Natural-Frequency Measurement
ಕ್ರಿಟಿಕಲ್ ವೇಗಗಳು ಸ್ವಾಭಾವಿಕ ಆವೃತ್ತಿಗಳಿಗೆ ಅನುಗುಣವಾಗಿರುತ್ತವೆ:
- the first critical speed occurs at the first natural frequency, the second critical at the second, and so on;
- the test gives experimental confirmation of analytical predictions; and
- it is widely used to validate finite-element models.
Damping Determination
The sharpness of each resonance peak reveals the system damping:
- sharp, high peaks indicate low damping;
- broad, low peaks indicate high damping;
- ಆ damping ratio can be calculated from the peak’s width and amplitude; and
- that figure is critical for predicting vibration levels in future operation.
Unbalance-Distribution Assessment
- phase relationships at the critical speeds reveal how the unbalance is distributed along the rotor;
- they can distinguish static from ದಂಪತಿ ಅಸಮತೋಲನ; ಮತ್ತು
- they help plan the balancing strategy before any weight is added.
2. Coastdown Test Procedure
ಸಿದ್ಧತೆ
- Install sensors: place accelerometers ಅಥವಾ ವೇಗ ರೂಪಾಂತರಗಳು at the bearing locations, in both horizontal and vertical directions.
- Install a tachometer: an optical or magnetic tachometer to track rotational speed and provide the phase reference.
- Configure data acquisition: set up continuous recording at an adequate sample rate.
- Define the speed range: typically from operating speed down to 10–20% of it, or until the machine stops.
ಕಾರ್ಯಗತಗೊಳಿಕೆ
- Stabilise at operating speed: run at normal speed until thermal equilibrium and steady vibration are reached.
- Initiate coastdown: disconnect drive power — motor, turbine, or other prime mover — and allow natural deceleration.
- Monitor continuously: record vibration amplitude, phase, and speed throughout the slowdown.
- Watch for safety: stay alert for excessive vibration that signals an unexpected resonance or ಅಸ್ಥಿರತೆ.
- Complete deceleration: keep recording until the machine stops or reaches the minimum speed of interest.
Data-Collection Parameters
- Sample rate: high enough to capture every frequency of interest — typically 10–20× the maximum frequency.
- ಅವಧಿ: set by rotor inertia, anywhere from 30 seconds to 10 minutes.
- ಮಾಪನಗಳು: amplitude, phase, and speed at all sensor locations.
- Synchronous sampling: data taken at constant angular increments to support ಆರ್ಡರ್ ವಿಶ್ಲೇಷಣೆ.
3. Data Analysis and Visualisation
ಬೋಡ್ ಪ್ಲಾಟ್
The standard view of coastdown data is the ಬೋಡ್ ಪ್ಲಾಟ್:
- upper trace: vibration amplitude versus speed;
- lower trace: phase angle versus speed;
- critical-speed signature: an amplitude peak with its matching 180° phase shift; and
- per location: separate plots for each measurement point and direction.
ವಾಟರ್ಫಾಲ್ ಪ್ಲಾಟ್
A ವಾಟರ್ಫಾಲ್ ಪ್ಲಾಟ್ (cascade diagram) gives a three-dimensional view:
- X-axis: frequency (Hz or orders);
- Y-axis: speed (rpm);
- Z-axis (colour): vibration amplitude;
- the 1× component appears as a diagonal line tracking speed;
- ನೈಸರ್ಗಿಕ ಆವೃತ್ತಿಗಳನ್ನು appear as horizontal lines at constant frequency; and
- their intersection — where the 1× line crosses a natural-frequency line — is a critical speed.
ಪೋಲರ್ ಪ್ಲಾಟ್
- vibration vectors are plotted at many speeds;
- a characteristic spiral forms as speed decreases through each critical speed; and
- the phase change is clearly visible as the vector sweeps round.
4. Coastdown vs. Runup Testing
ಕೋಸ್ಟ್ಡೌನ್ನ ಪ್ರಯೋಜನಗಳು
- No external power required: simply disconnect the drive and let the machine coast.
- Slower deceleration: more dwell time at each speed gives better frequency resolution.
- ಹೆಚ್ಚು ಸುರಕ್ಷಿತ: the system is shedding energy rather than gaining it.
- Less stress: critical speeds are passed on falling energy.
ರನ್ಅಪ್ನ ಪ್ರಯೋಜನಗಳು
- Controlled acceleration: the rate through critical speeds can be commanded.
- Part of normal startup: a ರನ್-ಅಪ್ ವಿಶ್ಲೇಷಣೆ can be gathered during a routine start.
- Active conditions: process loads are present, so the data is more representative of real operation.
ಹೋಲಿಕೆ ಪರಿಗಣನೆಗಳು
- ತಾಪಮಾನ: runup is usually performed cold; coastdown starts from hot operating conditions.
- Bearing stiffness: may differ between hot (coastdown) and cold (runup).
- Friction and damping: both are temperature-dependent and shift the peak amplitudes.
- Data comparison: differences between runup and coastdown traces can themselves reveal thermal or load effects.
5. Applications and Use Cases
ಹೊಸ-ಸಾಮಗ್ರಿ ಸಿದ್ಧೀಕರಣ
- verify that critical speeds match the design predictions;
- confirm adequate separation margins;
- validate the rotordynamic model; and
- establish ಮೂಲರೇಖೆ ದತ್ತಾಂಶ for future reference.
ಕಂಪನ ಸಮಸ್ಯೆಗಳ ತೊಂದರೆನಿರ್ಣಯ
- determine whether high vibration is speed-related (a resonance);
- uncover previously unknown critical speeds;
- assess the effect of a modification or repair; and
- separate resonance from other vibration sources.
Balancing Procedures
- ಗಾಗಿ ಮತ್ತು ಸಂಕೀರ್ಣ ಗೇರ್ ವ್ಯವಸ್ಥೆಗಳು. ಅವರು ಎರಡು-ಚ್ಯಾನಲ್ FFT ವಿಶ್ಲೇಷಣೆ, ಅಂತಹ ಮುಂದಸಾಲಿನ ತಂತ್ರಗಳನ್ನು ಪ್ರವೀಣ, coastdown identifies which modes need balancing;
- it helps choose the right balancing speeds; and
- it verifies the improvement after ವಿಧಾನ ಸಮತೋಲನ.
ಬದಲಾವಣೆಗಳ ಪರಿಶೀಲನೆ
- after bearing changes, confirm the resulting critical-speed shift;
- after mass or stiffness changes, check the predicted natural-frequency change; and
- compare before-and-after coastdowns to quantify the improvement.
6. Best Practices for Coastdown Testing
ಸುರಕ್ಷತಾ ಪರಿಗಣನೆಗಳು
- make sure everyone nearby knows the test is in progress;
- watch vibration closely for unexpected resonances;
- keep an emergency-shutdown capability available;
- clear the area around the equipment; and
- if excessive vibration develops, consider an emergency stop rather than finishing the coastdown.
ಡೇಟಾ ಗುಣಮಟ್ಟ
- Right deceleration rate: not so fast that there are too few data points per speed, nor so slow that thermal conditions drift during the run.
- ಸ್ಥಿರ ಪರಿಸ್ಥಿತಿಗಳು: minimise process-variable changes during the test.
- Multiple runs: perform two or three coastdowns to verify repeatability.
- All locations at once: record every bearing simultaneously.
ದಾಖಲೀಕರಣ
- record the operating conditions — temperature, load, configuration;
- capture the complete vibration and speed data;
- generate the standard analysis plots (Bode, waterfall, polar);
- identify and mark every critical speed found; and
- compare against design predictions or previous test data, then archive it.
7. Interpretation of Results
ನಿರ್ಣಾಯಕ ವೇಗಗಳನ್ನು ಗುರುತಿಸುವುದು
- look for amplitude peaks in the Bode plot;
- confirm each with its 180° phase shift;
- note the speed at which the peak occurs; and
- calculate the separation margin from operating speed.
ತೀವ್ರತೆಯ ಮೌಲ್ಯಮಾಪನ
- Peak amplitude: how high does vibration climb at the critical speed?
- Peak sharpness: a sharp peak means low damping and a potential problem.
- Operating proximity: how close is the running speed to a critical speed?
- ಸ್ವೀಕಾರ್ಯತೆ: a separation margin of about ±15–20% is typically required.
ಮುಂದುವರಿದ ವಿಶ್ಲೇಷಣೆ
- extract ಮೋಡ್ ಆಕಾರಗಳು from multi-point measurements;
- calculate damping ratios from the peak characteristics;
- distinguish forward from backward ವರ್ಲ್ modes; and
- compare the results against ಕ್ಯಾಂಪ್ಬೆಲ್ ರೇಖಾಚಿತ್ರ predictions.
8. Coastdown in the Field
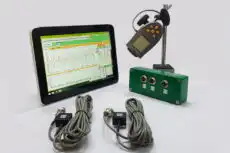
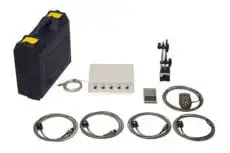
On site, a coastdown does not require a dedicated test stand — it can be captured with a portable instrument the moment the drive is switched off. A two-channel analyser such as the ಬ್ಯಾಲೆನ್ಸೆಟ್-1ಎ, with its laser tachometer providing the phase reference, records amplitude, phase, and speed continuously as the rotor slows, so the engineer can read the critical-speed peaks straight off the resulting Bode trace. The same dataset that locates a resonance also confirms whether a 1× unbalance is contributing, letting diagnosis and a follow-up field balancing job flow from a single run-down. In short, coastdown testing supplies empirical data that complements analytical prediction and reveals the genuine dynamic behaviour of rotating machinery under real operating conditions.