Mjerenje relativne vibracije rotora primjenom senzora linearnog pomaka bez kontakta
Sa Balanset-1A možete mjeriti relativnu vibracija od rotor koristeći kodere linearnog pomaka bez kontakta.
1.1 Odabir vrste senzora i postavljanje
Ovisno o zadatku, za mjerenja se mogu koristiti senzori vibracija ili senzori pomaka. Za odabir vrste senzora potrebno je na ploči “Vrsta senzora” (na dnu glavnog prozora) staviti oznaku u polje “Vibro” ili “Linearni”.
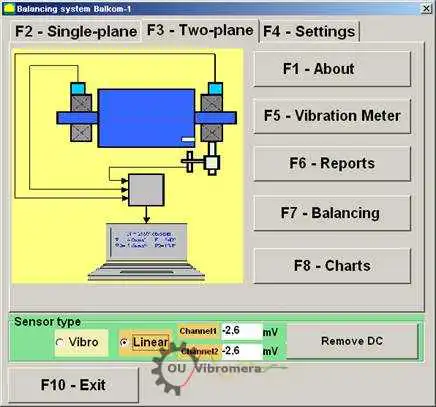
Slika 1. Glavni radni prozor programa Balanset.T
Prije početka mjerenja potrebno je provjeriti da li su koeficijenti pretvorbe senzora ispravno postavljeni. U tu svrhu pritisnite dugme “F4-Settings” u glavnom radnom prozoru programa (vidi sl. 1) i otvorite prozor postavki namijenjen za unos koeficijenata pretvorbe (vidi sl. 2).
U radnom prozoru prikazanom na Slici 2, u odgovarajuća polja treba unijeti koeficijente pretvorbe linearnih i vibracionih senzora. Ovi koeficijenti su navedeni u pasošu instrumenta. Obično ih nije potrebno mijenjati.
Za linearni radna zapremina senzori korišteni u setu instrumenta Balanset-1A, koeficijenti pretvorbe su redom jednaki:
- Kprl1= 0.94 mV/μm (conversion coefficient of the sensor of the 1st channel);
- Kprl2 = 0.94 mV/μm (conversion coefficient of the sensor of the 2nd channel.
Za ispravan rad linearni enkoder mora biti postavljen na određenoj udaljenosti od površine mjernog objekta. Nominalni razmak između površine i kraja senzora iznosi 3,5 mm. U tom slučaju na izlazu senzora postoji konstantan napon od 2,48 V. Ovaj napon će biti prikazan u poljima “Channel1” i “Channel2” za prvi, odnosno drugi kanal.
Da biste ga kompenzirali, morate pritisnuti dugme “Remove DC”. Mali preostali pomak neće ometati mjerenje.
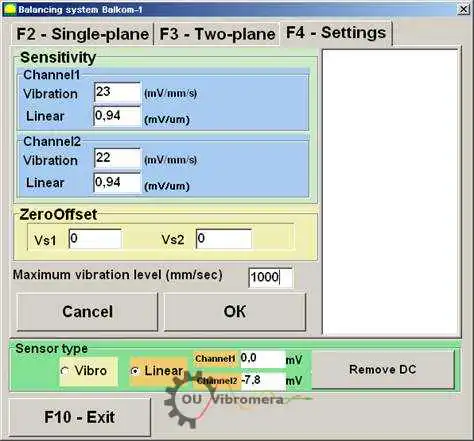
Slika 2. Radni prozor za unos koeficijenata pretvorbe i odabir tipa korištenih senzora
Pažnja! Navedene vrijednosti nominalnog zazora i faktori pretvorbe linearnih enkodara dati su za rotore od čelika. Za rotore od ostalih metala (bakar, bronza, aluminijum) nominalni zazor i koeficijenti pretvorbe senzora trebaju biti određeni eksperimentalno od strane korisnika provođenjem kalibracije.
Da biste sačuvali promijenjene parametre, pritisnite dugme “OK”. Novi parametri bit će sačuvani u datoteci i korišteni za daljnja mjerenja.
1.2 Mjerenje radijalne ekscentričnosti rotora
Radijalna ekscentričnost rotora može se mjeriti beskontaktnim senzora blizine u dvije korekcijske ravnine prema shemi prikazanoj na sl. 3. Kako bi se izmjerila i prikazala vremenska funkcija i spektar ekscentričnosti rotora, ako je potrebno, mora se provesti niz pripremnih operacija, uključujući:
- – select diametrical sections of the rotor, in which the measurements will be carried out;
- instalaciju beskontaktnih linearnih senzora pomaka 5 i 6 i faza senzora kuta 7 na krovat stroja koristeći specijalne uređaje (npr. magnetne tronošce);
- – connect proximity sensors of linear motion to connectors X1 and X2, and phase angle sensor to connector X3 of the measuring unit;
- – set a nominal measuring gap ∆ between the rotor surface and the sensing element for each linear encoder (for the rotor made of steel ∆ = 3.5 mm);
- – place on the rotor the reflective mark required for triggering for the phase angle sensor 7 and check the sensor triggering;
- povezati mjerni uređaj sa računarom.
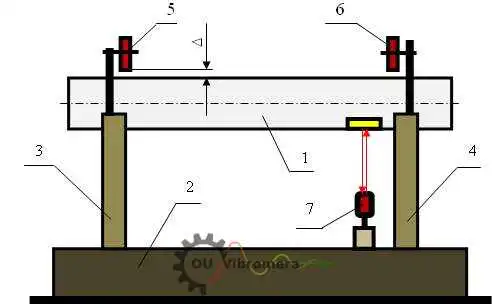
Slika 3. Mjerenje radijalnog bacanja rotora
Ako u glavnom radnom prozoru (vidi sl. 1) pritisnete dugme “F7 – Charts”, na ekranu računara pojavljuje se radni prozor “Graphs” (vidi sl. 5), namijenjen izradi različitih vrsta grafikona radijalnog bacanja rotora.
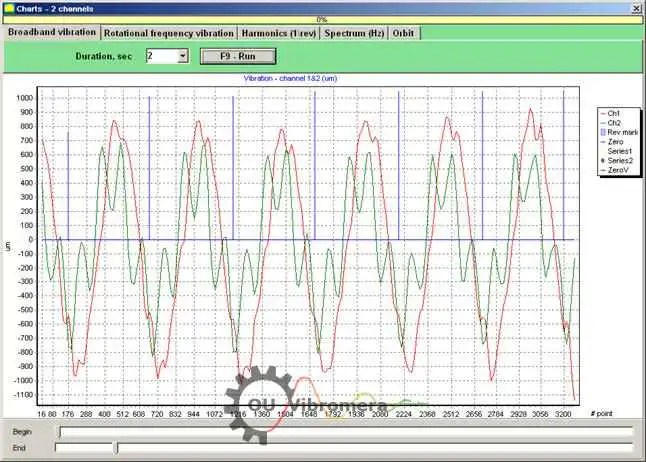
Slika 5. Radni prozor načina “Charts”
Dugmići u ovom prozoru grade sljedeće grafike:
- Kada u ovom prozoru pritisnete dugme “Broadband vibration”, prikazuje se vremenska funkcija radijalnog bacanja rotora.
- Ako se pritisne dugme “Rotation frequency vibration”, prikazuje se vremenska funkcija recipročne komponente radijalnog bacanja rotora.
- Ako pritisnete dugme “Harmonics (1/rev)”, na ekranu će se prikazati grafikon razlaganja bacanja rotora na harmonijski niz. Prvi harmonik odgovara vrijednosti vibracije na frekvenciji obrtanja rotora (1x), drugi – na dvostrukoj frekvenciji (2x), itd.
- Pritiskom na dugme “Spectrum (Hz)” na ekranu se prikazuje spektar radijalnog bacanja rotora.
- Pritiskom na dugme “Orbit” prikazuje se grafikon orbite rotora (precesije).
1.3 Izgradnja grafa orbite rotora
Konstrukcija grafikona orbite rotora može se izvršiti prema shemi prikazanoj na slici 6.
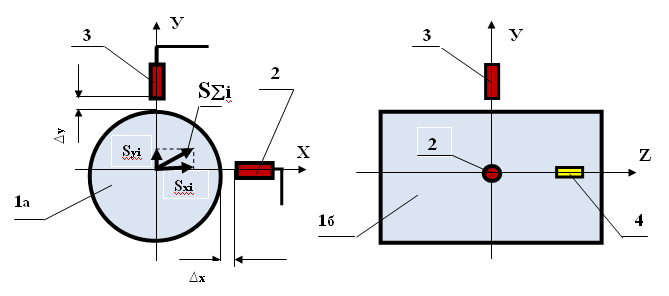
Slika 6. Shema mjerenja orbite rotora 1a – rotor (pogled s kraja); 1b – rotor (bočni pogled); 2, 3 – beskontaktni senzori; 4 – reflektujuća oznaka senzora faznog ugla.
Radi izvršenja mjerenja i izgradnje odgovarajućeg grafikona, neophodno je provesti niz pripremnih operacija, uključujući:
- – install the non-contact linear encoders 2 and 3 in one of the diametrical sections of the rotor at an angle of 90° to each other, provided that the measuring axis of encoder 2 must coincide with the X axis, and the measuring axis of encoder 3 must coincide with the Y axis;
- podesite nazivni mjerni zazor ∆x (∆y) između površine rotora i mjernog elementa svakog linearnog enkodera (za čelik ∆ = 3,5 mm);
- – set the phase angle sensor (not shown in the scheme) in the X – Z plane, coinciding with the installation plane of non-contact sensor 2;
- – set a reflective mark 4 on the rotor 1 in the X – Z plane, which is necessary for the phase angle sensor operation;
- – connect non-contact linear encoders 2 and 3 to connectors X1 and X2, and phase angle encoder to connector X3 of the measuring unit;
- povezati mjerni uređaj sa računarom.
Za početak mjerenja orbite rotora u glavnom radnom prozoru (vidi sl. 1) pritisnite dugme “F7 – Charts” i pređite u radni prozor “Graphs” (vidi sl. 5), namijenjen izradi različitih vrsta grafikona radijalnog bacanja rotora. U tom radnom prozoru morate pritisnuti dugme “Orbit”, nakon čega se na ekranu računara pojavljuje radni prozor u kojem se izvodi potreban ciklus mjerenja (vidi sl. 7).
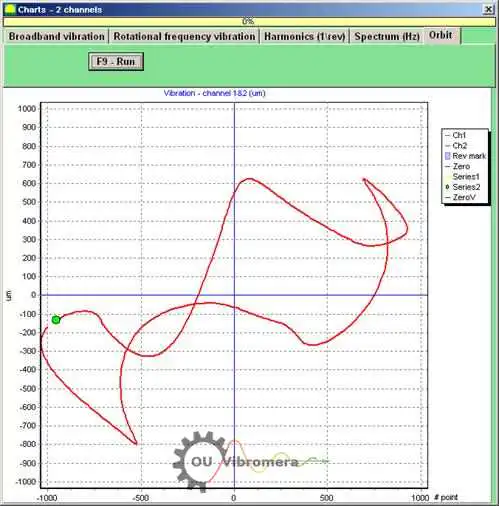
Slika 7. Grafikon orbite rotora. Balanset softver.
Da biste nastavili rad u navedenom radnom prozoru (vidi sl. 7), potrebno je uključiti rotaciju rotora i pritiskom na dugme “F9 – RUN” izvršiti mjerenje trenutnih vrijednosti radijalnog bacanja rotora Sxi i Syi u periodu jednakom jednom obrtaju rotora.
Niz trenutnih vrijednosti Sxi i Syi dobijenih tokom mjerenja koristi se za crtanje orbite kontrolisanog rotora (svaka i-ta tačka orbite ima koordinate Sxi, Syi). Trenutna vrijednost radijalnog pomjeranja izračunava se prema formuli:
S∑i = √ (Sxi² + Syi²) (1)
gdje je S∑i trenutna vrijednost radijalnog pomjeranja (dužina vektora radijusa orbite rotora), izračunata za i-tu tačku grafika;
- Sxi – trenutna vrijednost radijalnog bacanja rotora, mjerena duž X ose senzorom 2 (vidi sl. 6) u i-toj tački;
- Syi – trenutna vrijednost radijalnog bacanja rotora, mjerena duž Y ose senzorom 3 (vidi sl. 6) u i-toj tački.

Nikolai Shelkovenko
Nikolai Shelkovenko je inženjer analize vibracija te osnivač i izvršni direktor kompanije Vibromera. Više od 15 godina balansira rotacionu opremu na terenu, a ne na ispitnom stolu: malčere, industrijske ventilatore, drobilice, centrifuge, vratila i vretena. Upravo je iz tog rada nastala serija instrumenata Balanset — osmišljeni su kao alat koji stručnjak može ponijeti do mašine i njime raditi sam, na licu mjesta, a ne kao laboratorijska oprema. Vibromera je osnovana 2017. godine, a od 2023. sjedište joj je u Portu u Portugalu. Ovdje se odvijaju razvoj, sklapanje i podrška za liniju Balanset. Vodeći instrument je Balanset-1A, prijenosni analizator za balansiranje u jednoj i dvije ravni te za vibracijsku dijagnostiku. Nikolai lično učestvuje u podršci korisnicima, u rješavanju složenih slučajeva balansiranja i u razvoju softvera. Radi s korisnicima širom svijeta, na bilo kojem jeziku.